Featured Models
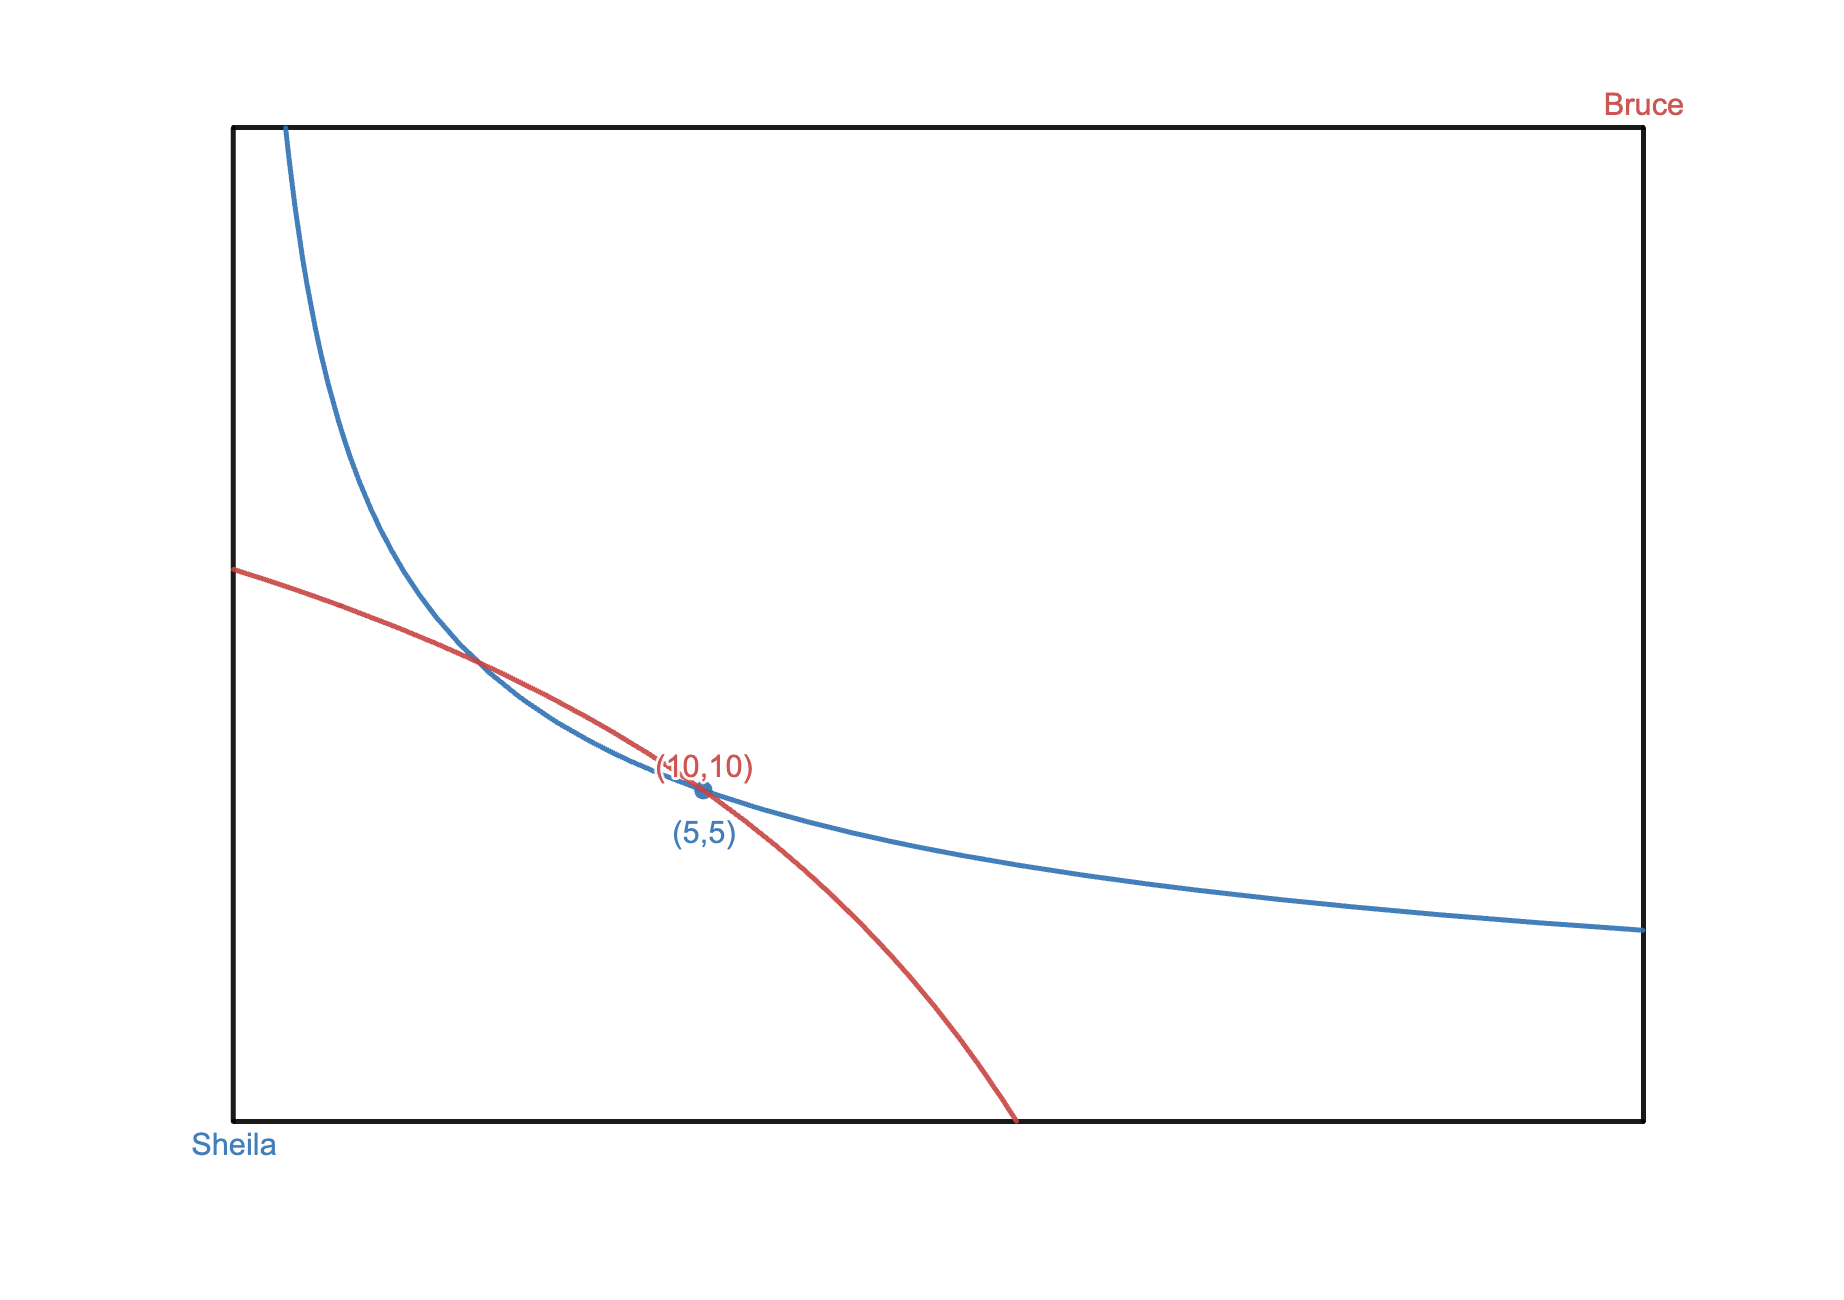
Exchange Economy
Graph an Edgeworth Box for a two-good economy
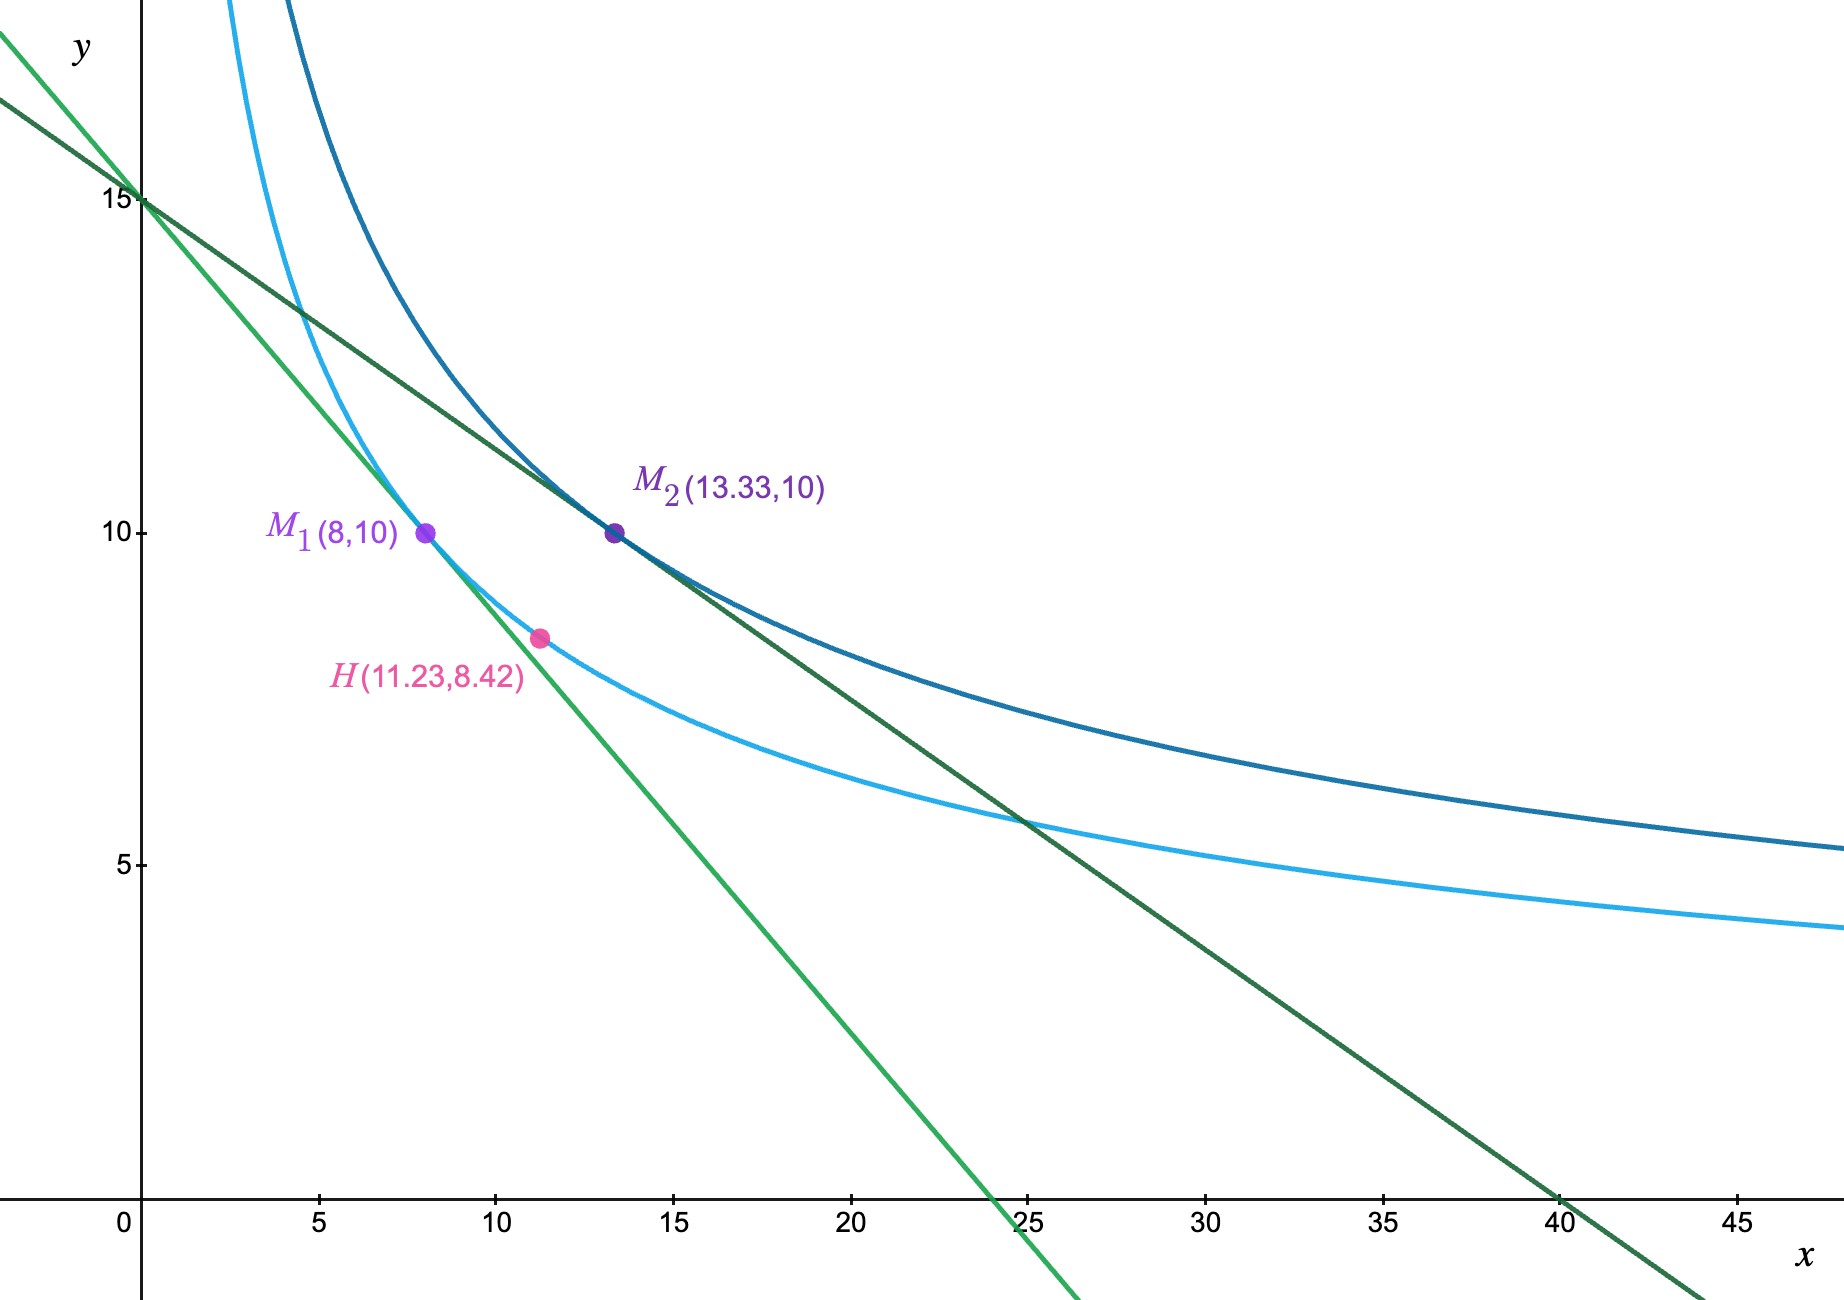
Effect of a Price Change
Visualize the impact of a price change on Marshallian and Hicksian demands
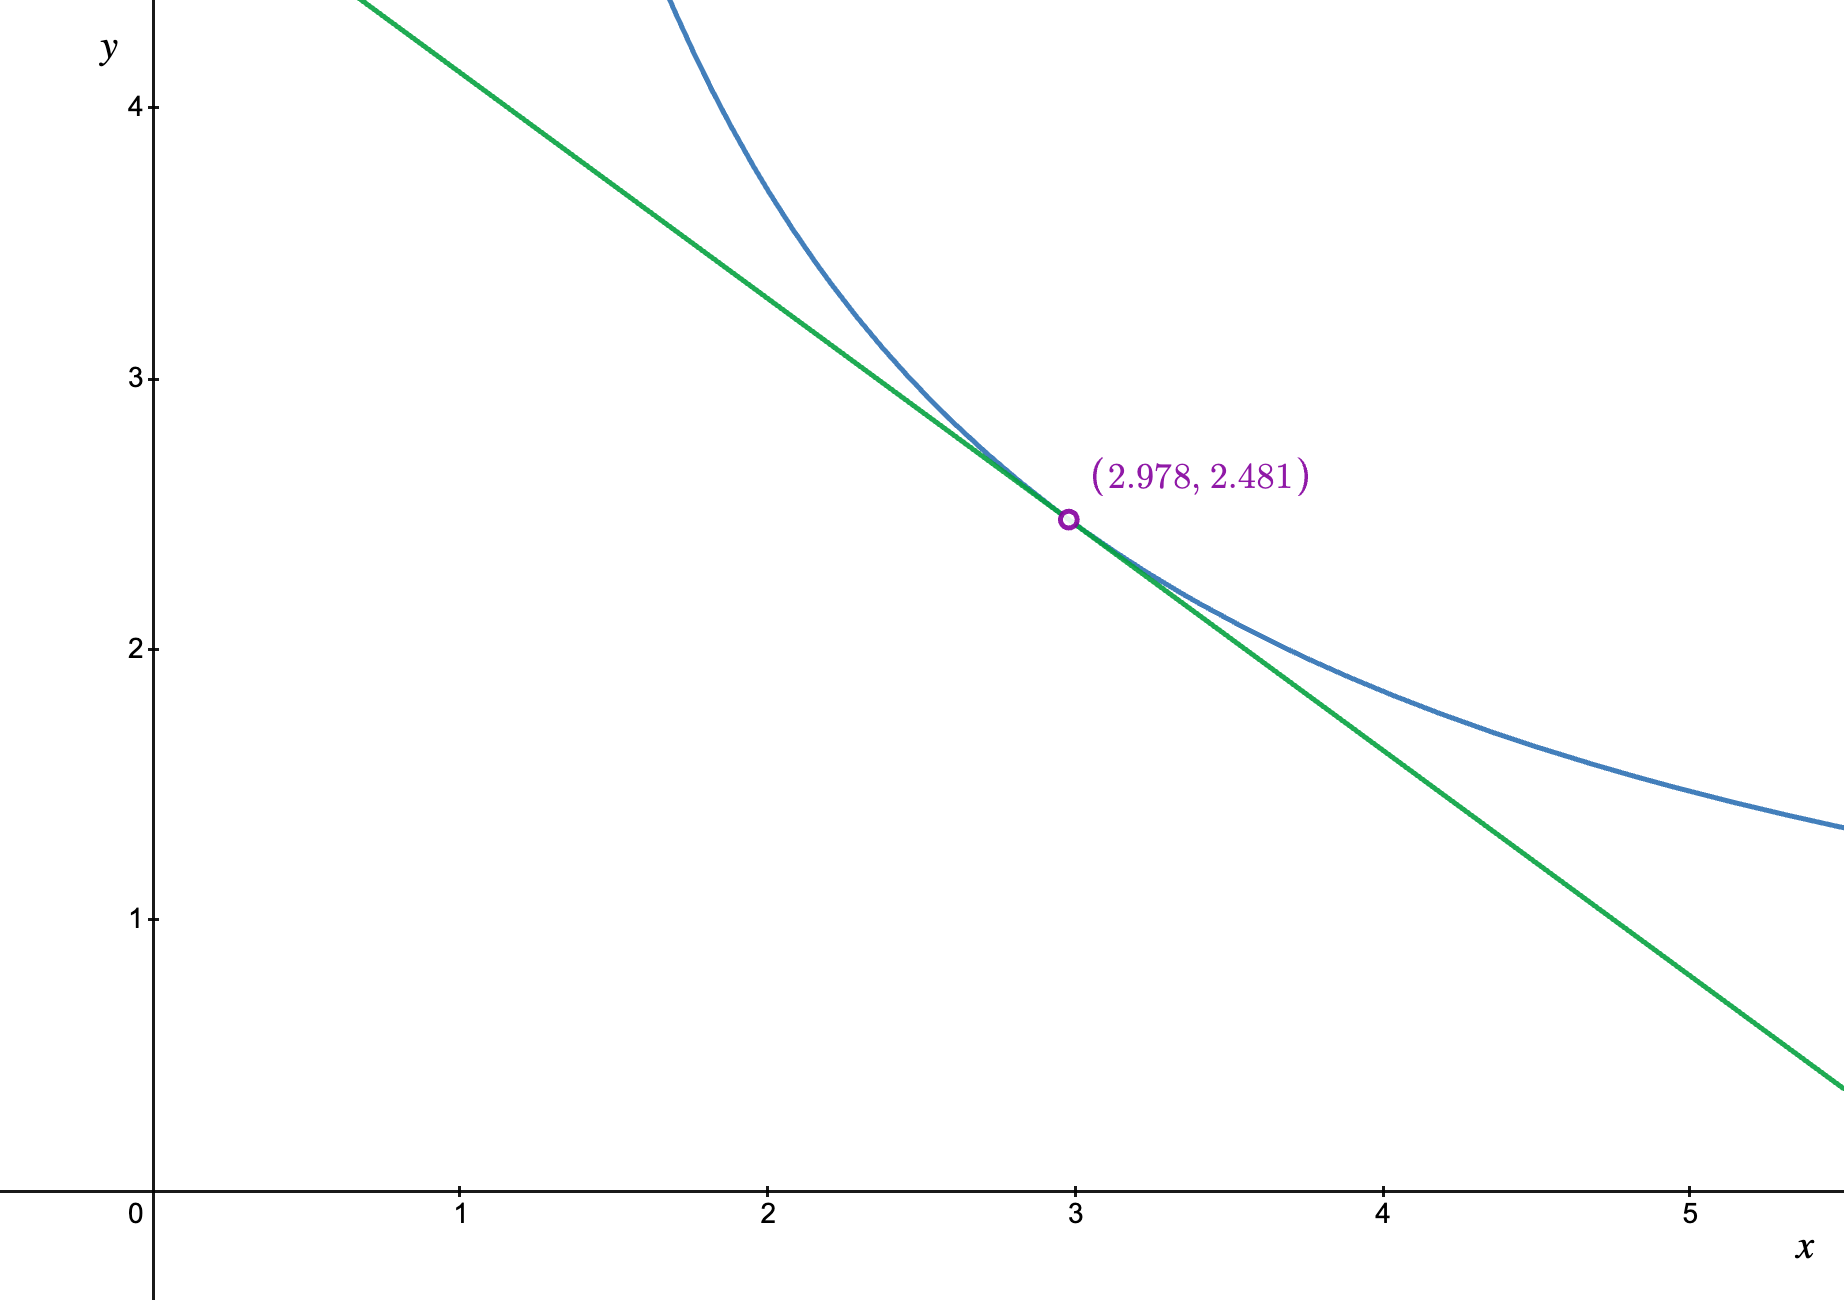
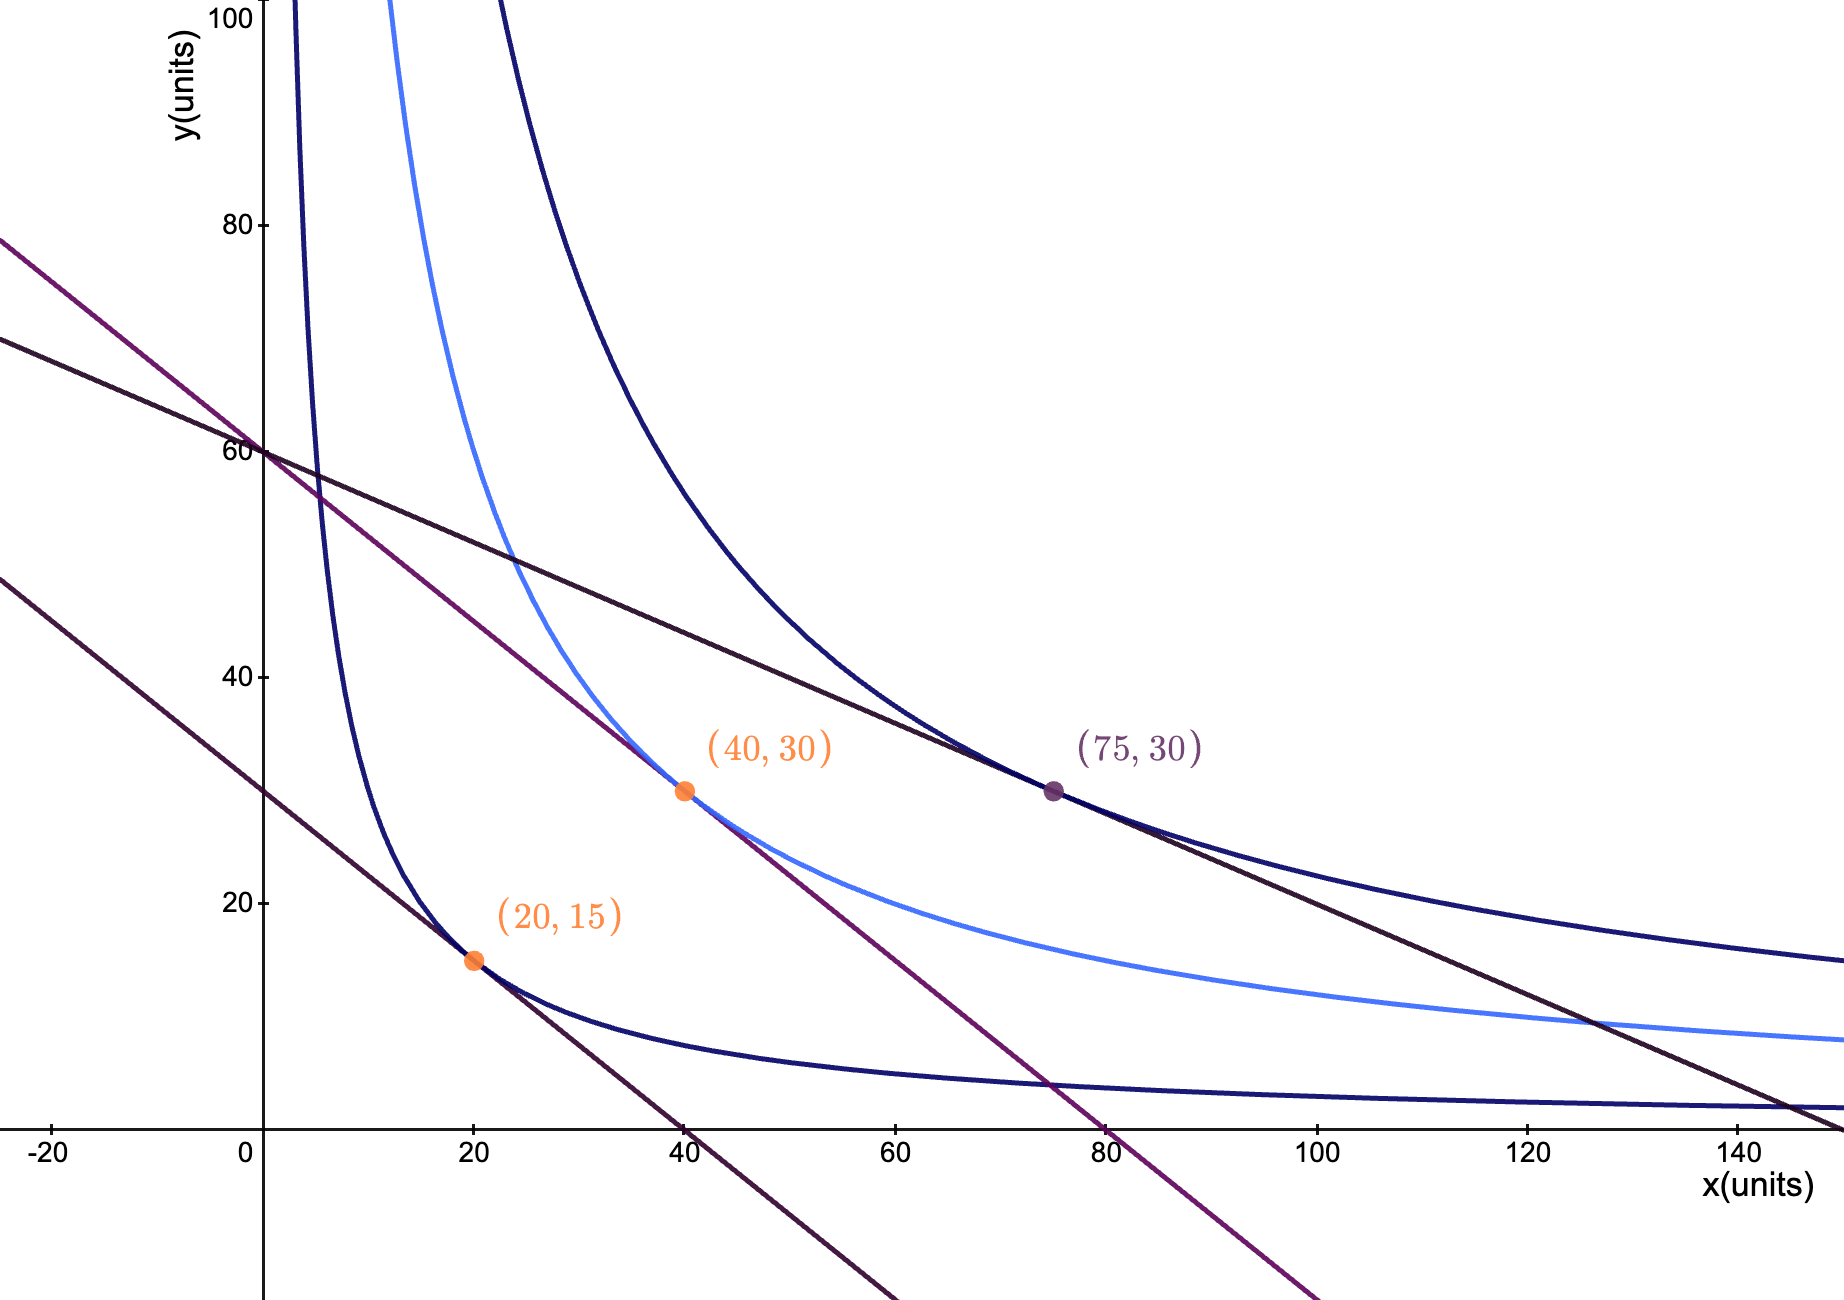
Hicksian Demand
Input utility functions and isocost lines to find Hicksian demand bundles
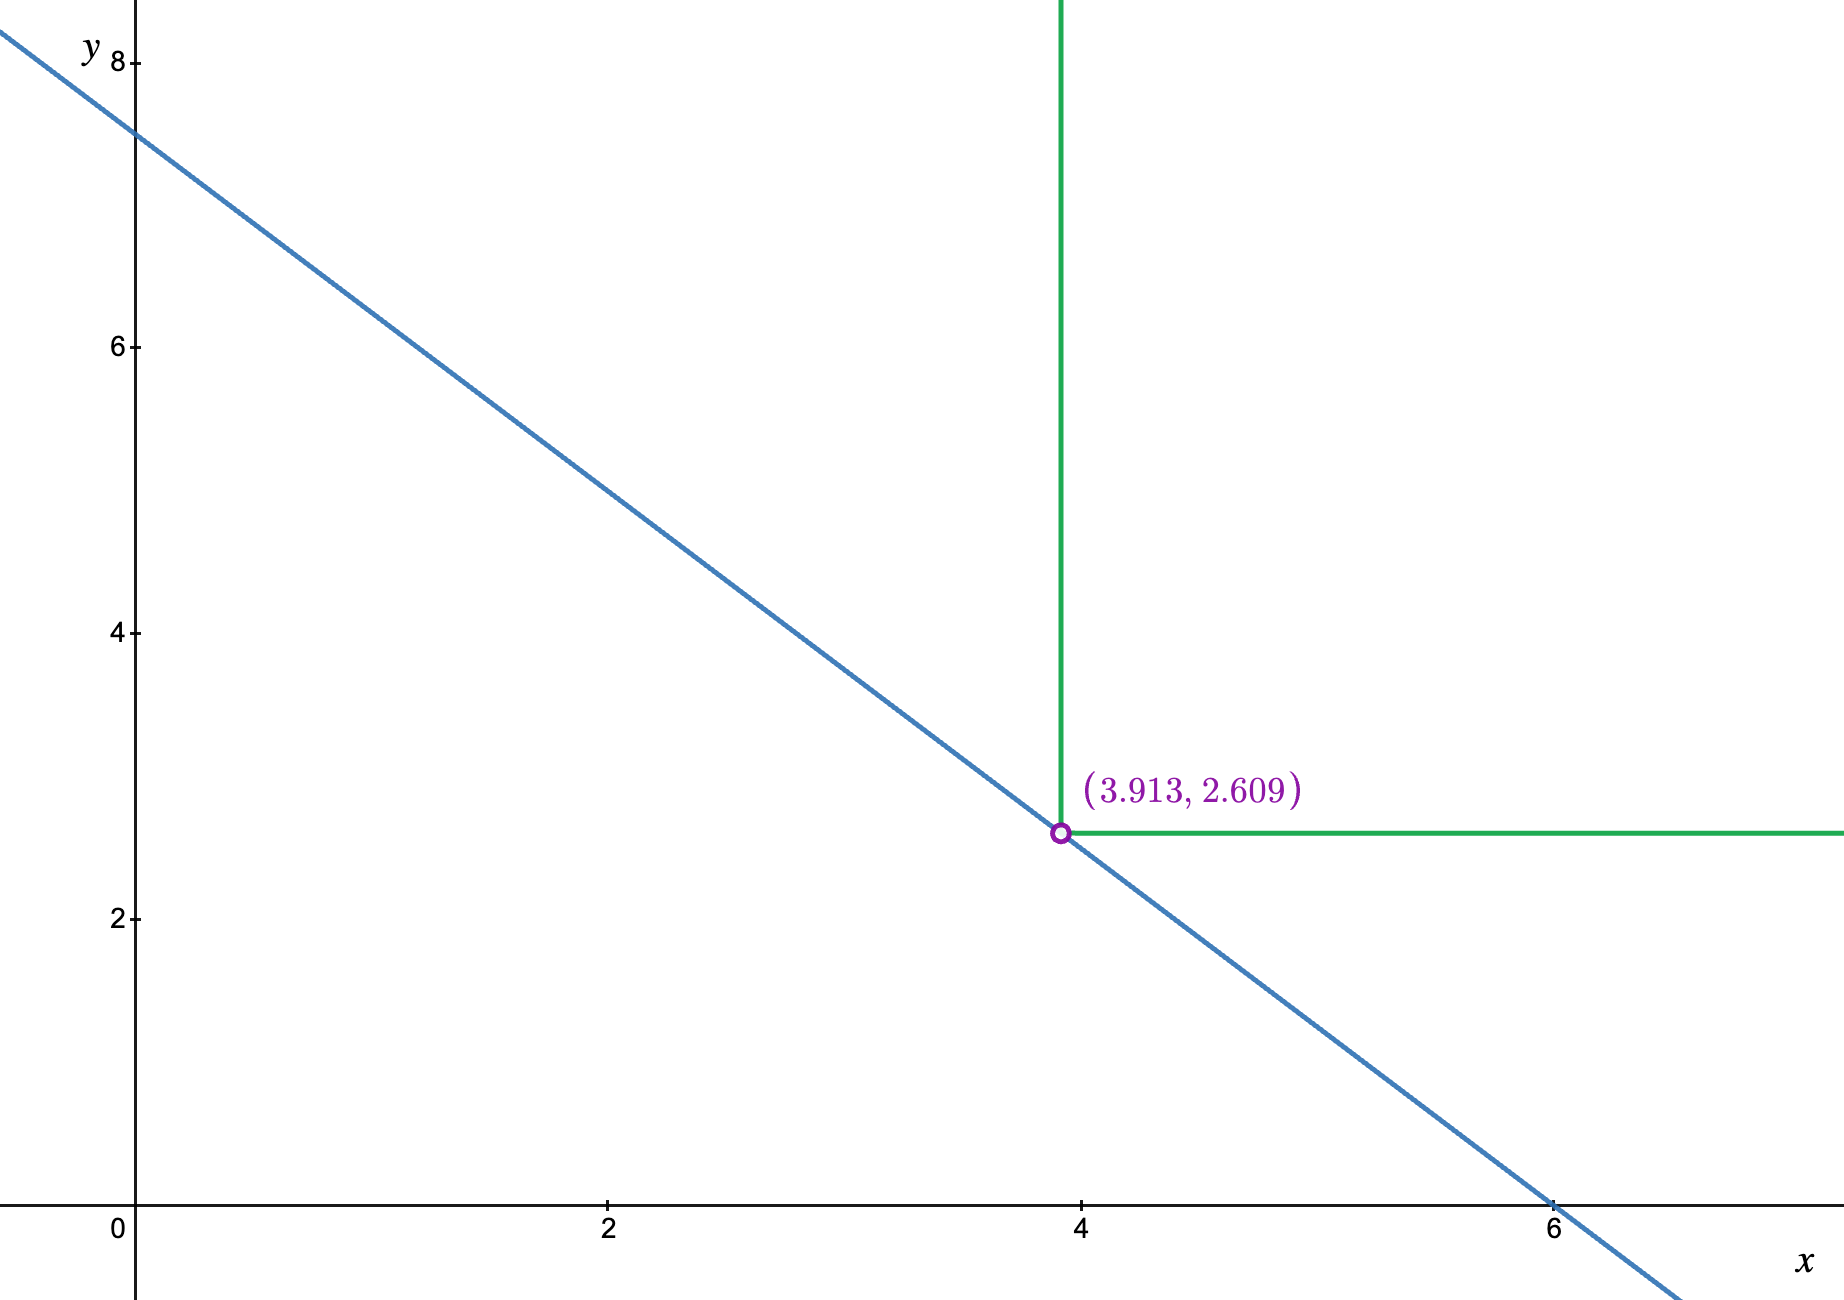
Marshallian Demand
Input utility functions and budget lines to find Marshallian demand bundles
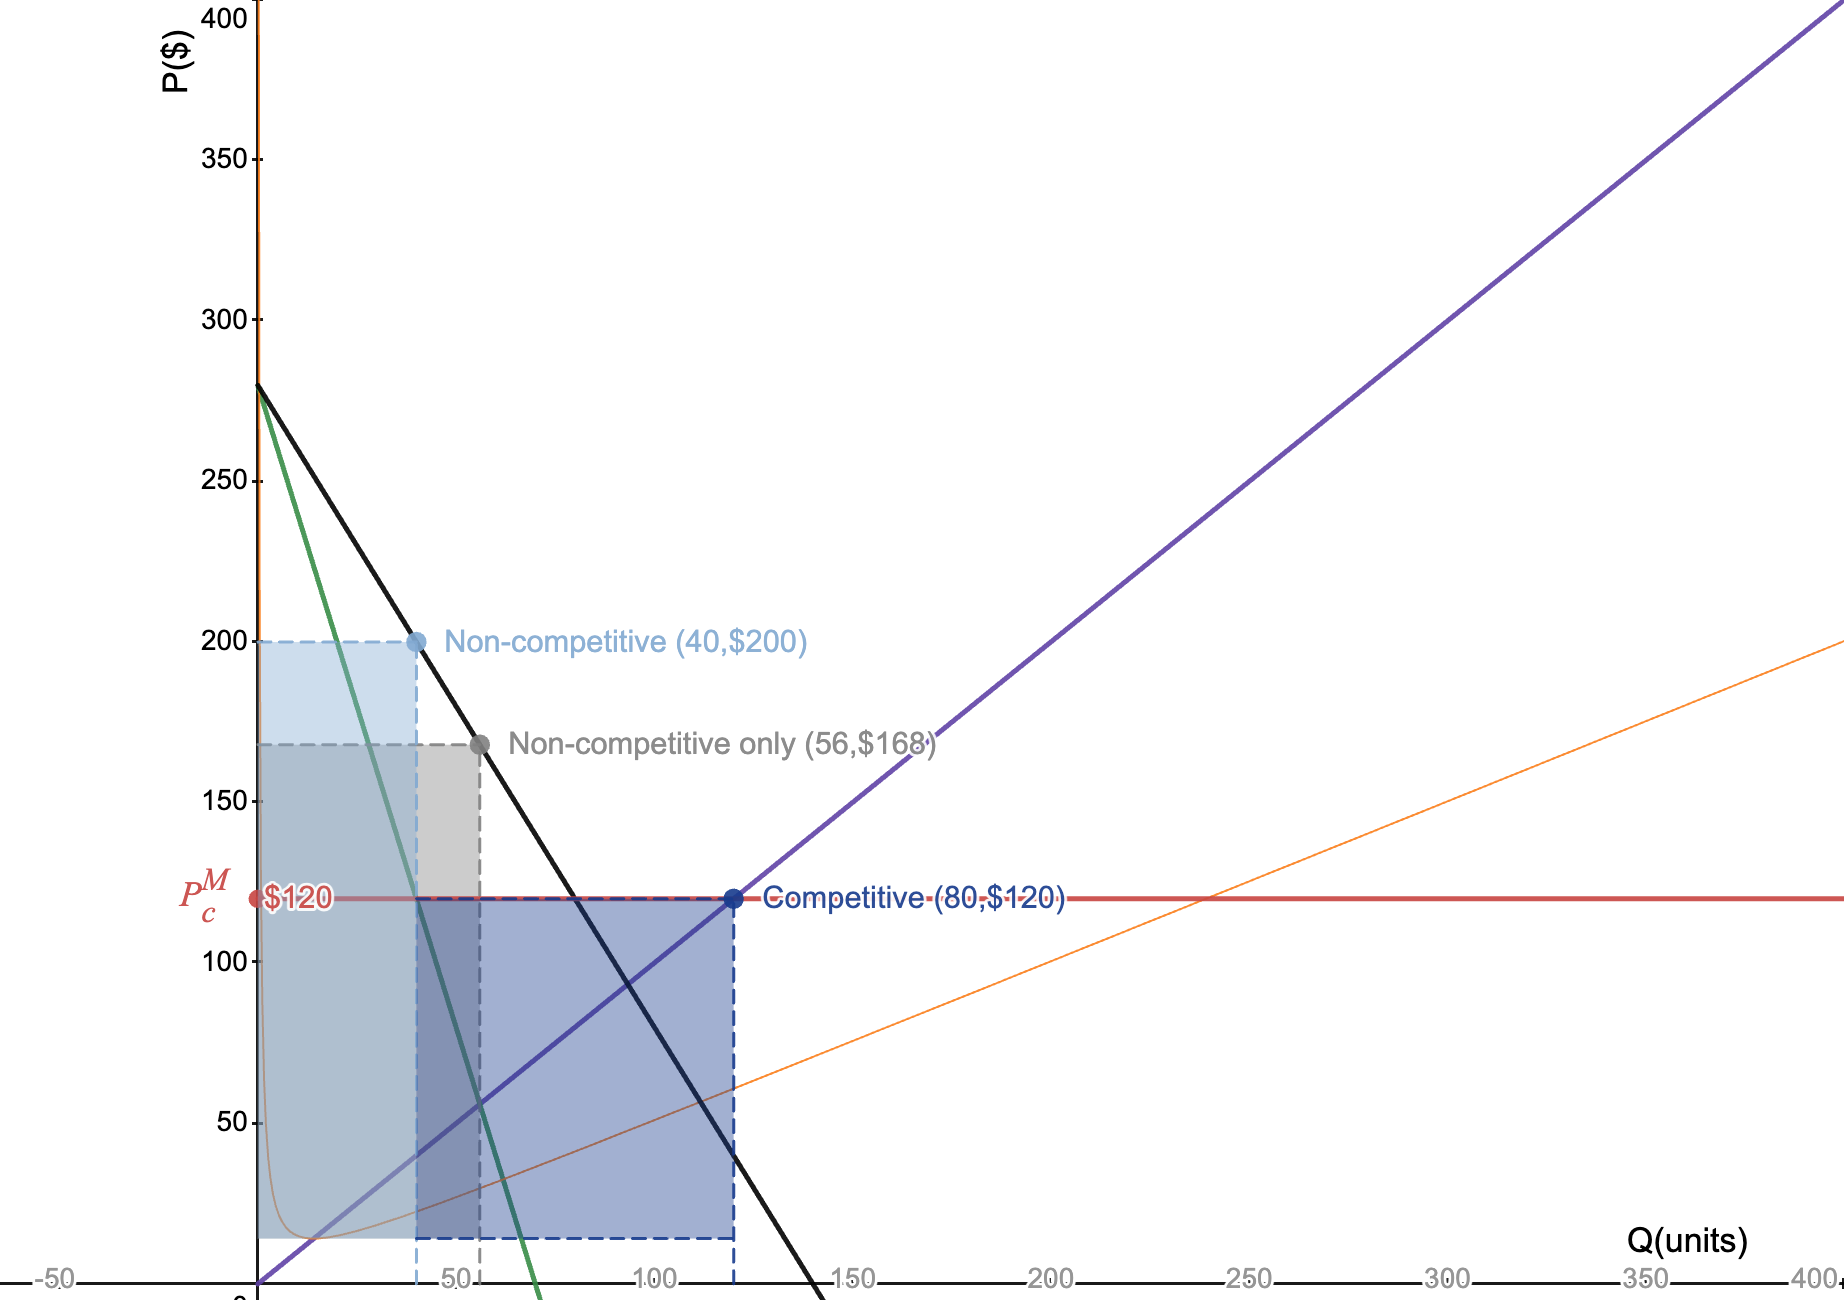
Multi Market Pricing
Visualize output decisions across two markets (competitive and non-competitive)
Multiple Marshallian Bundles
Visualize how budget changes affect Marshallian demand bundles
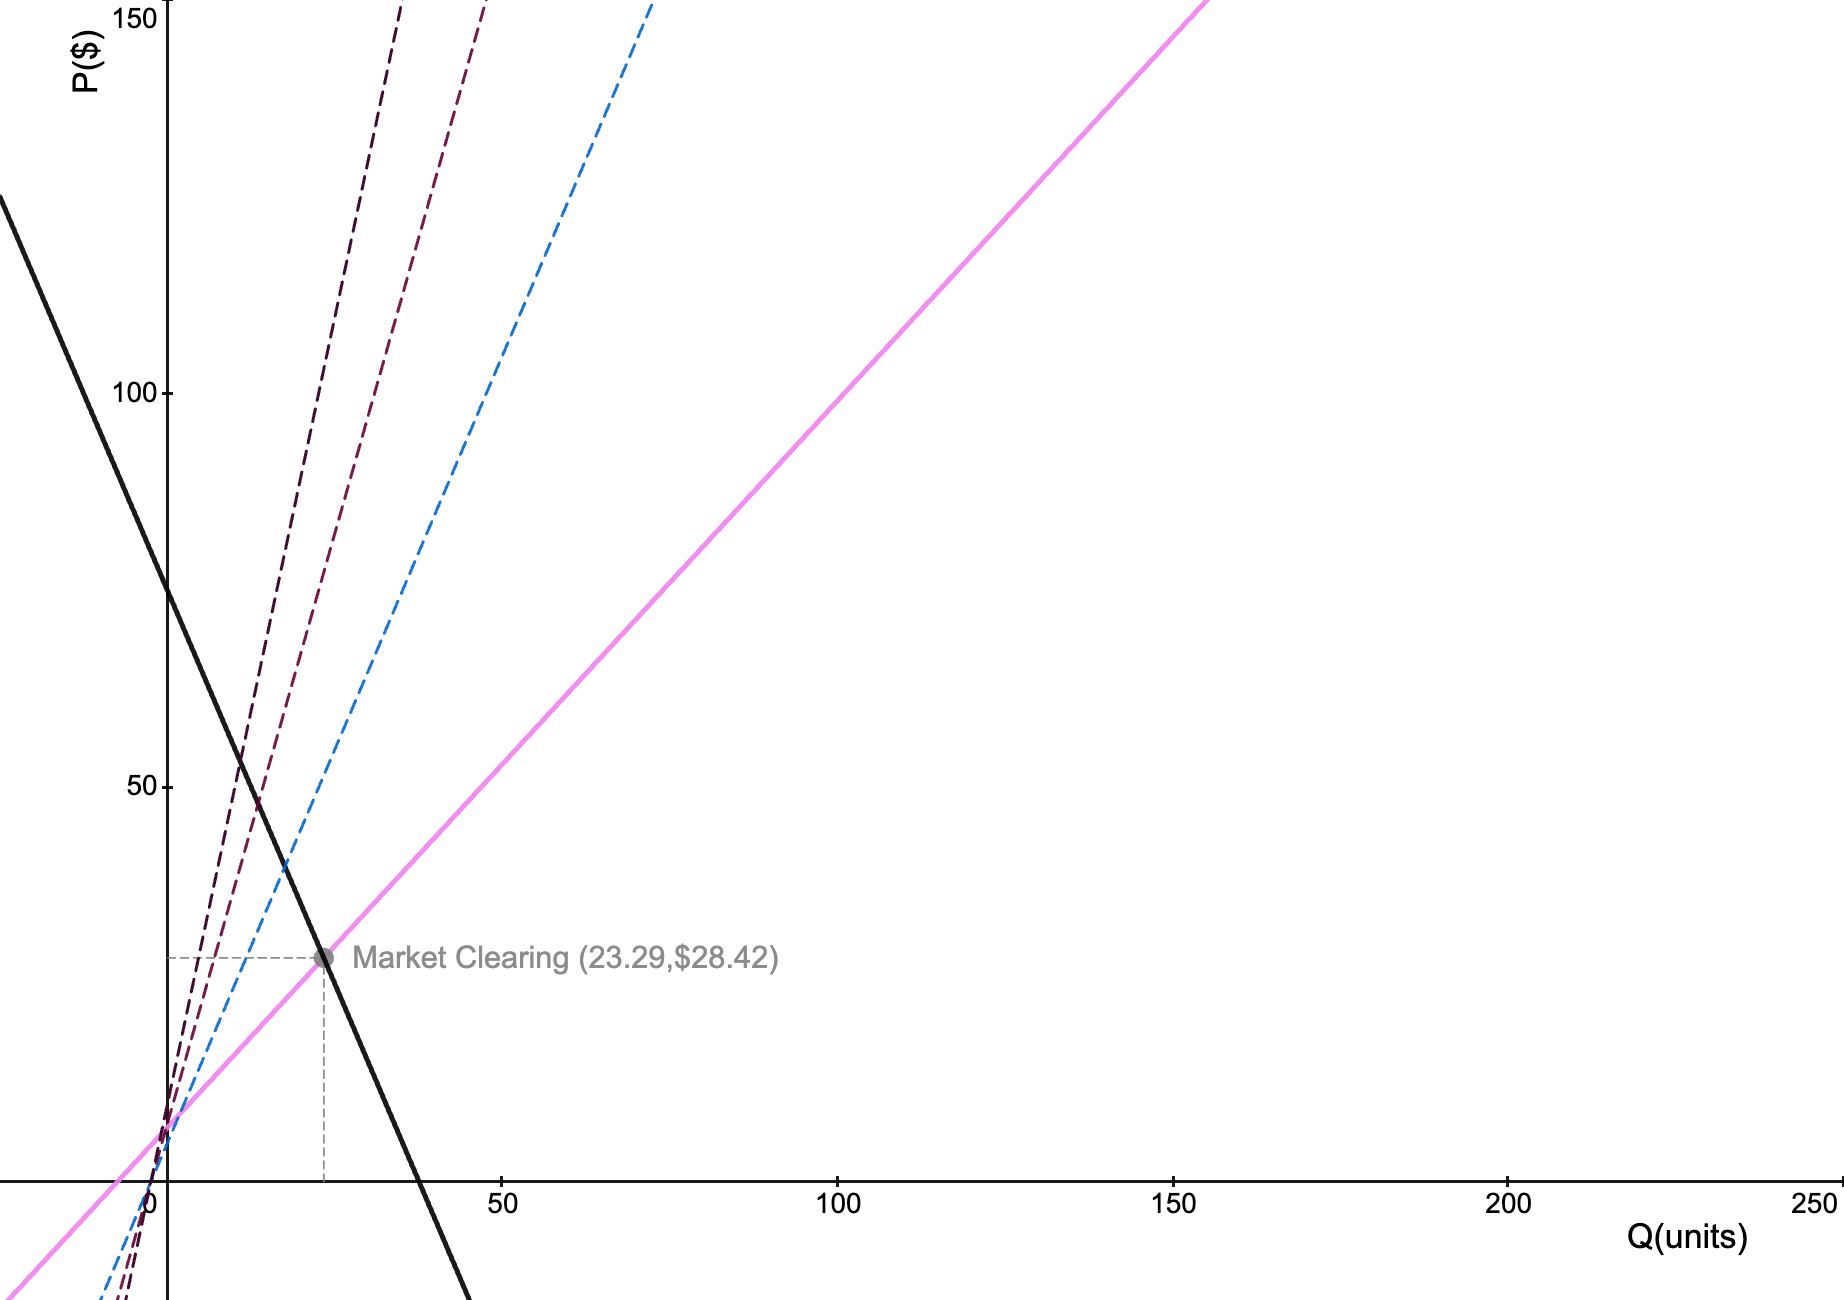
Price Dynamics
Visualize the entry and exit of firms in a market
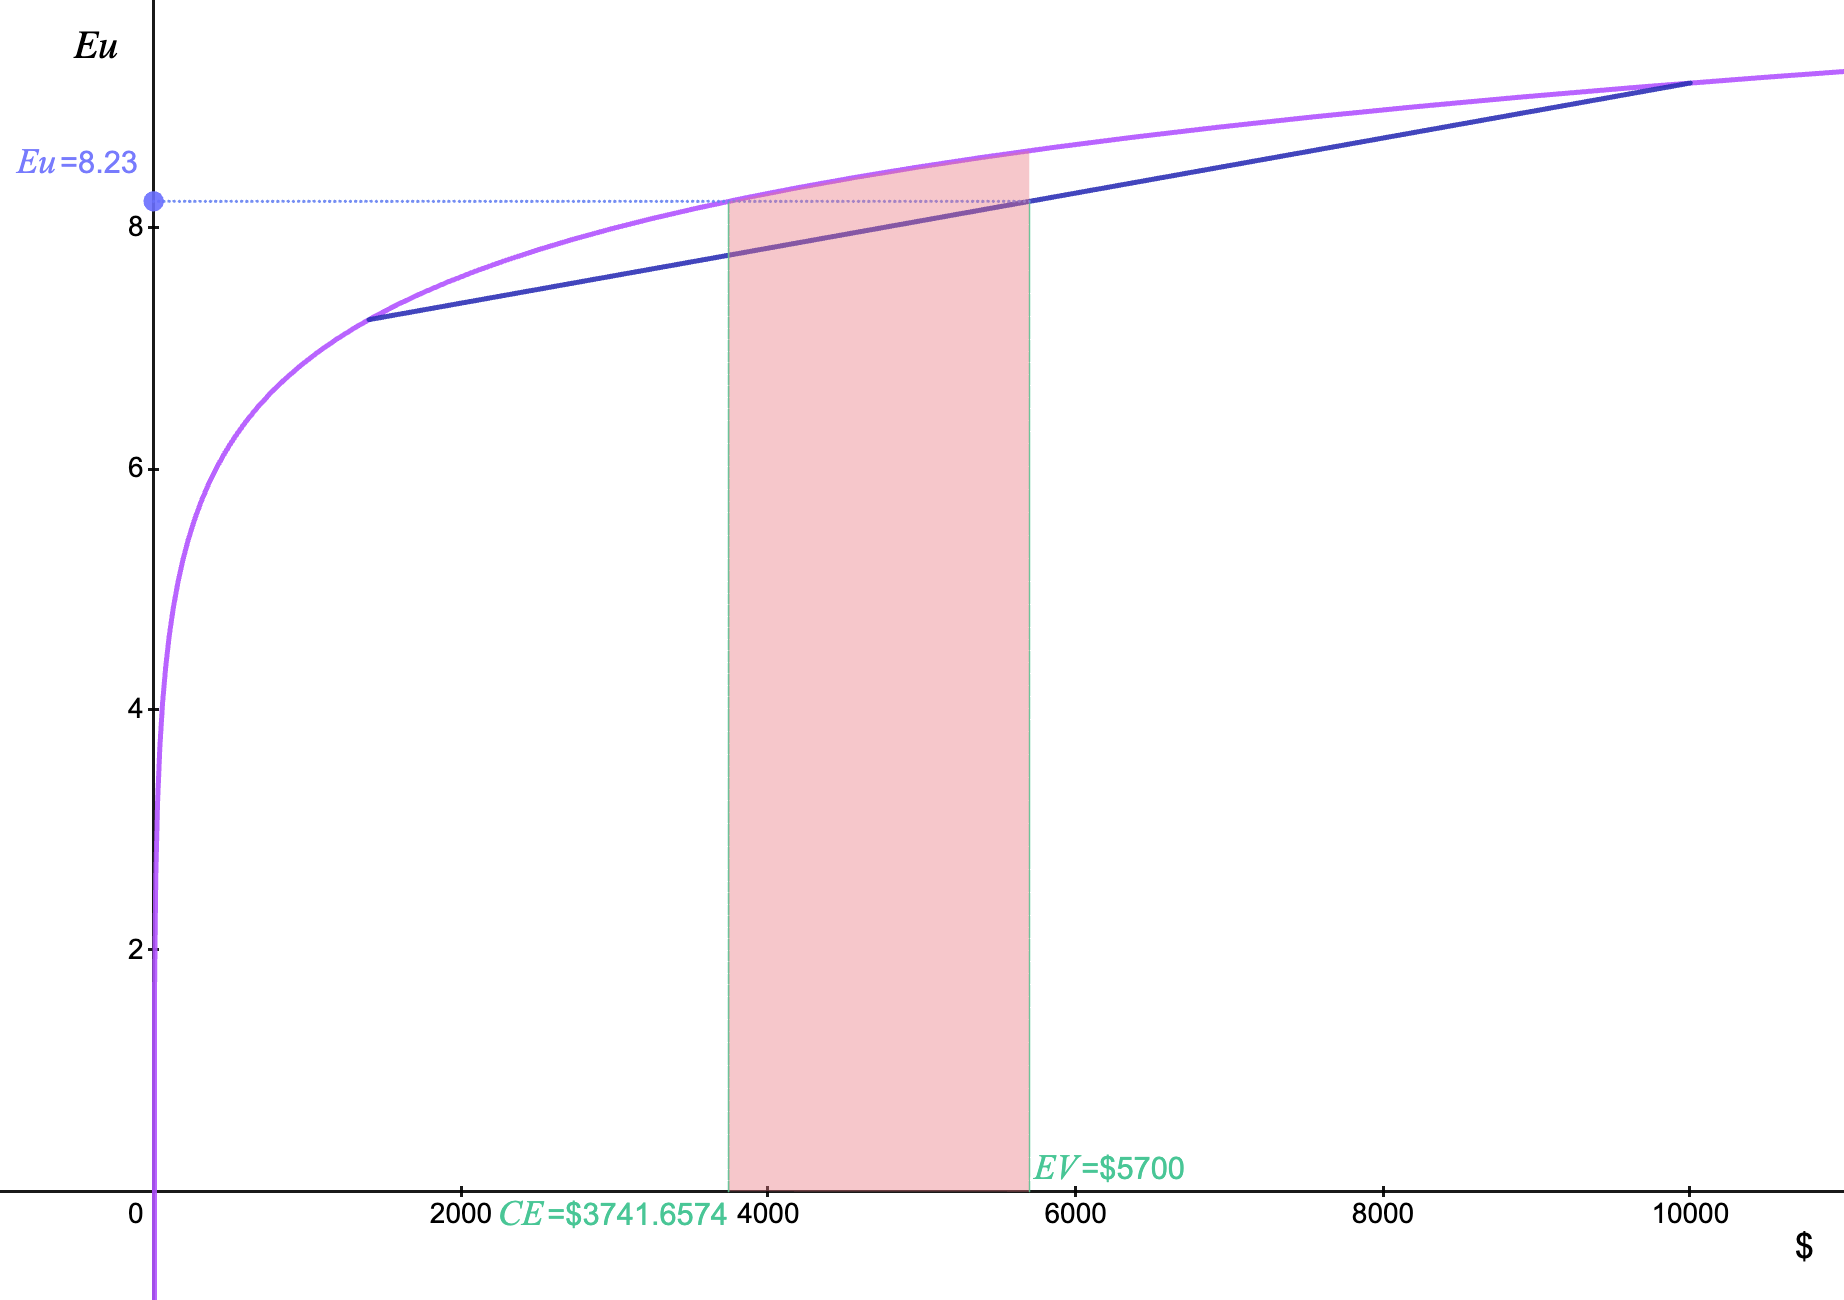
Risk - Expected Utility
Find expected utility, compensating variation and equivalent variation
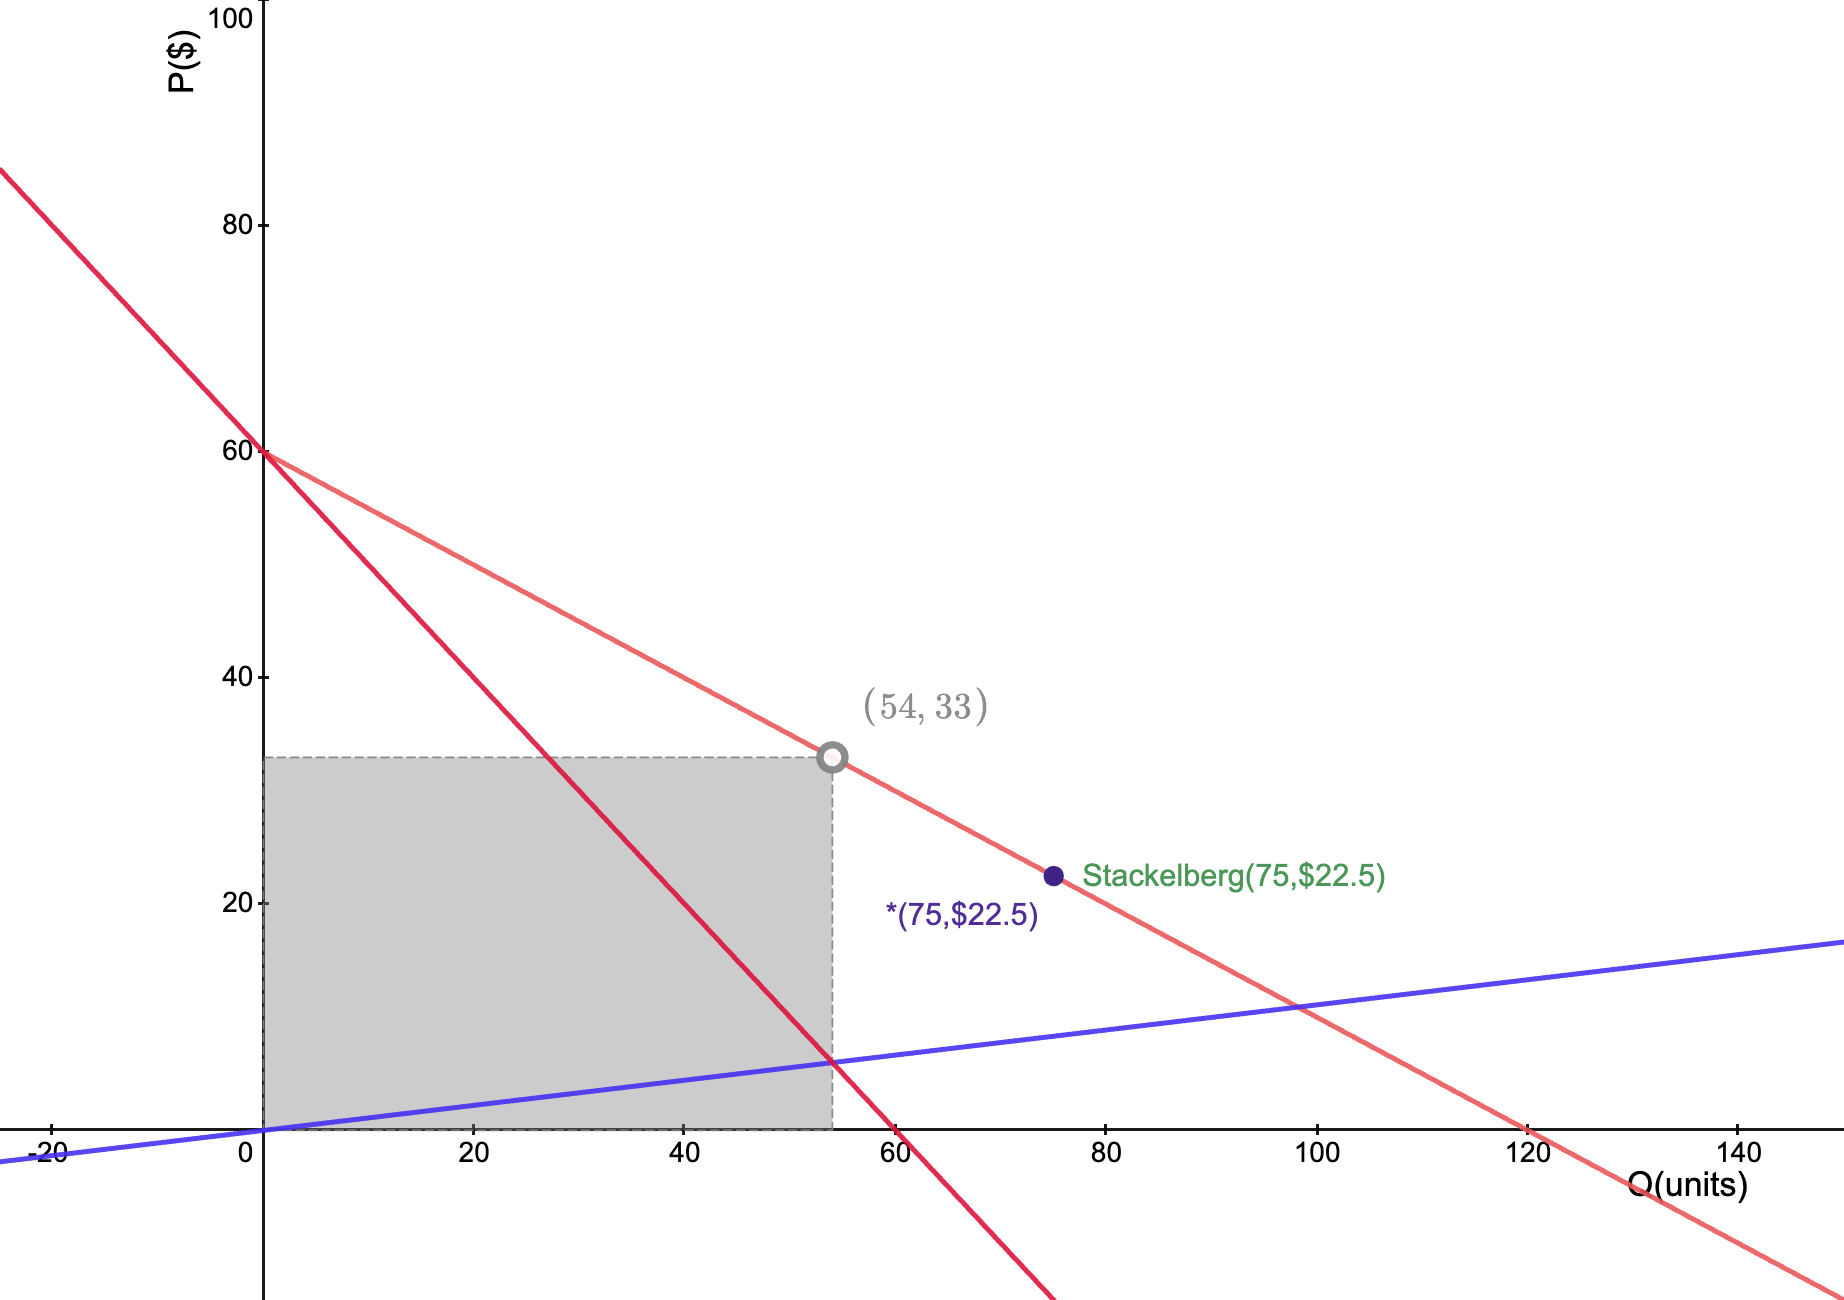
Stackelberg
Model leader-follower dynamics
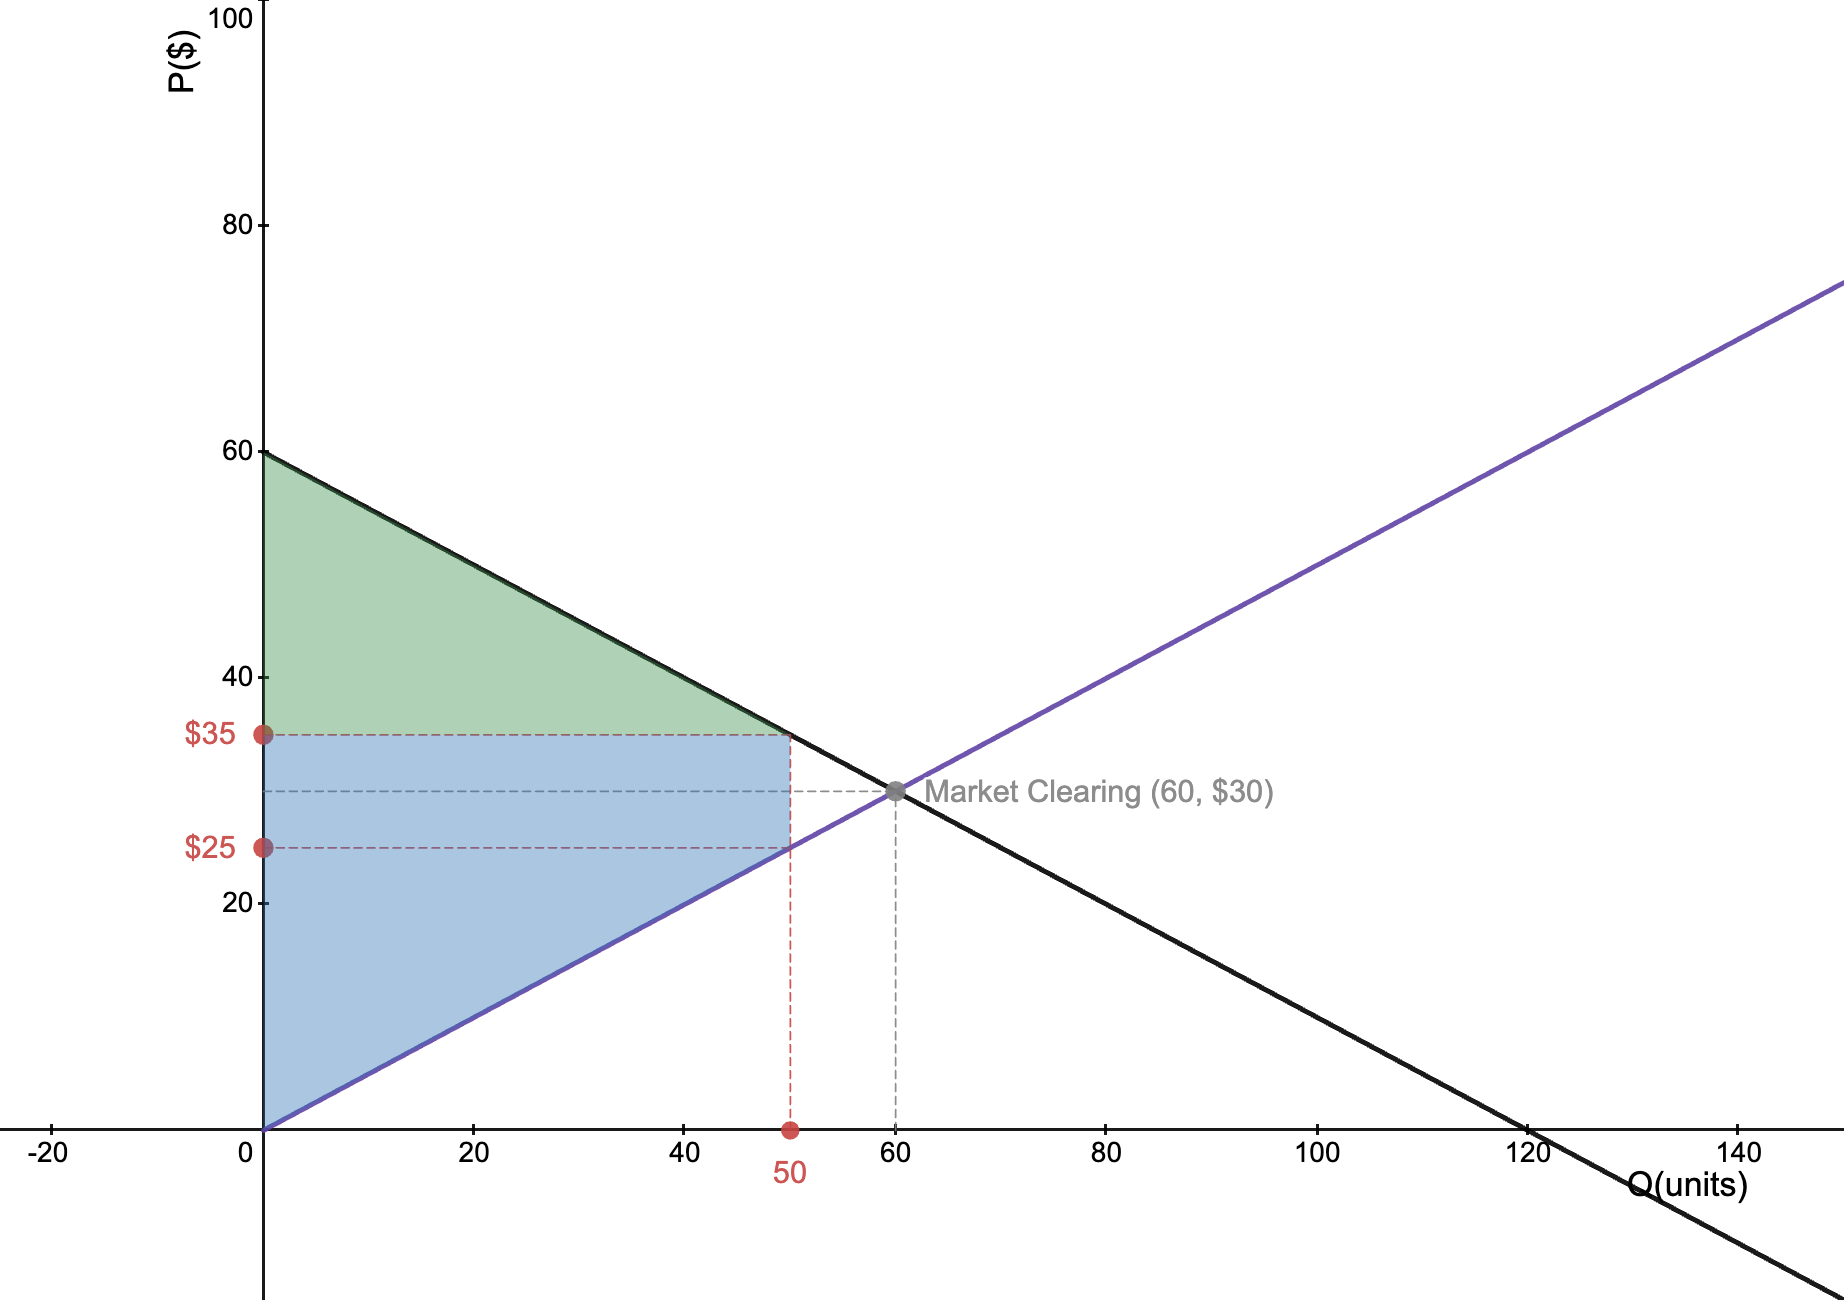
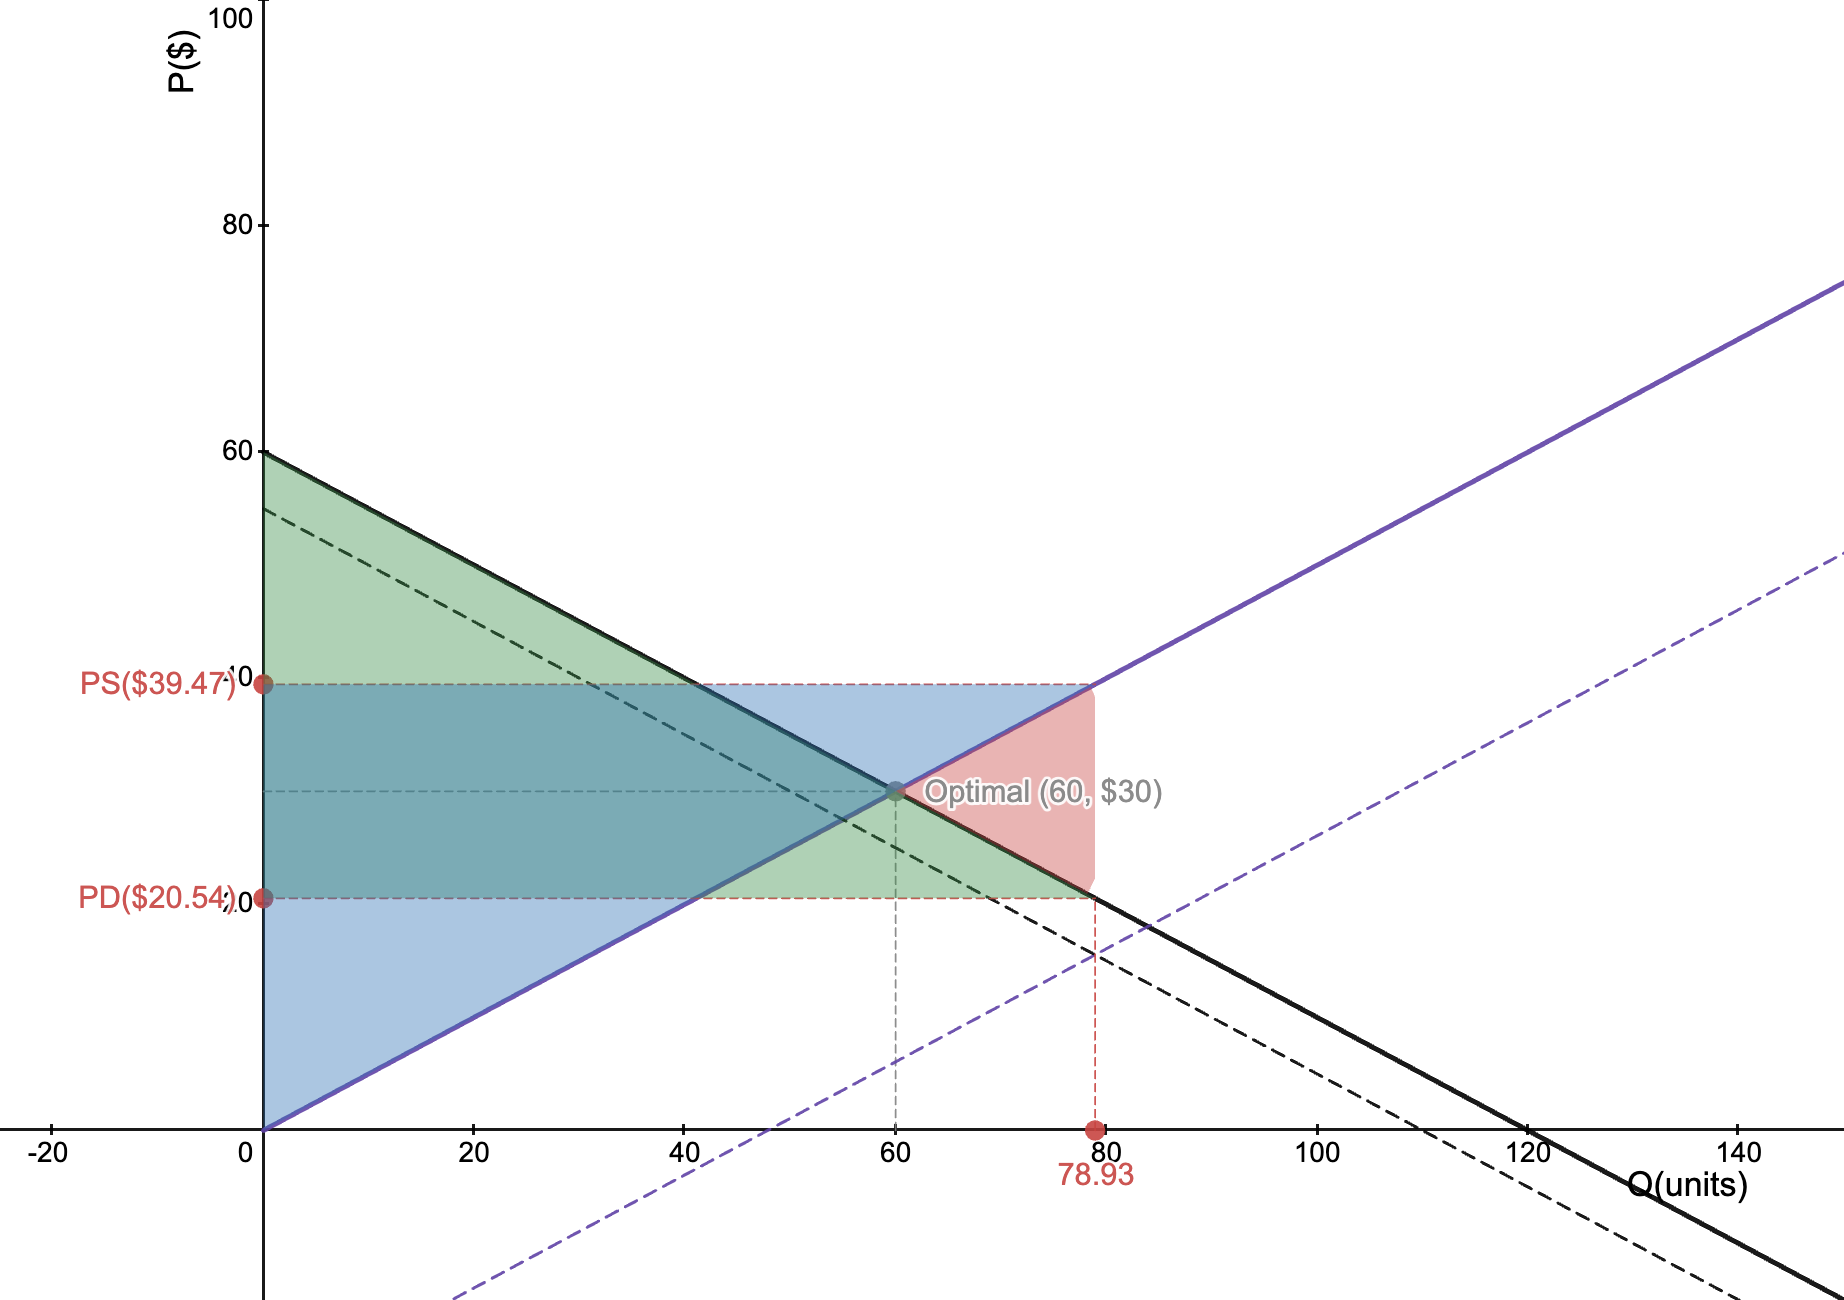
Surplus
Visualize welfare impacts of taxes, subsidies, quotas, and price floors
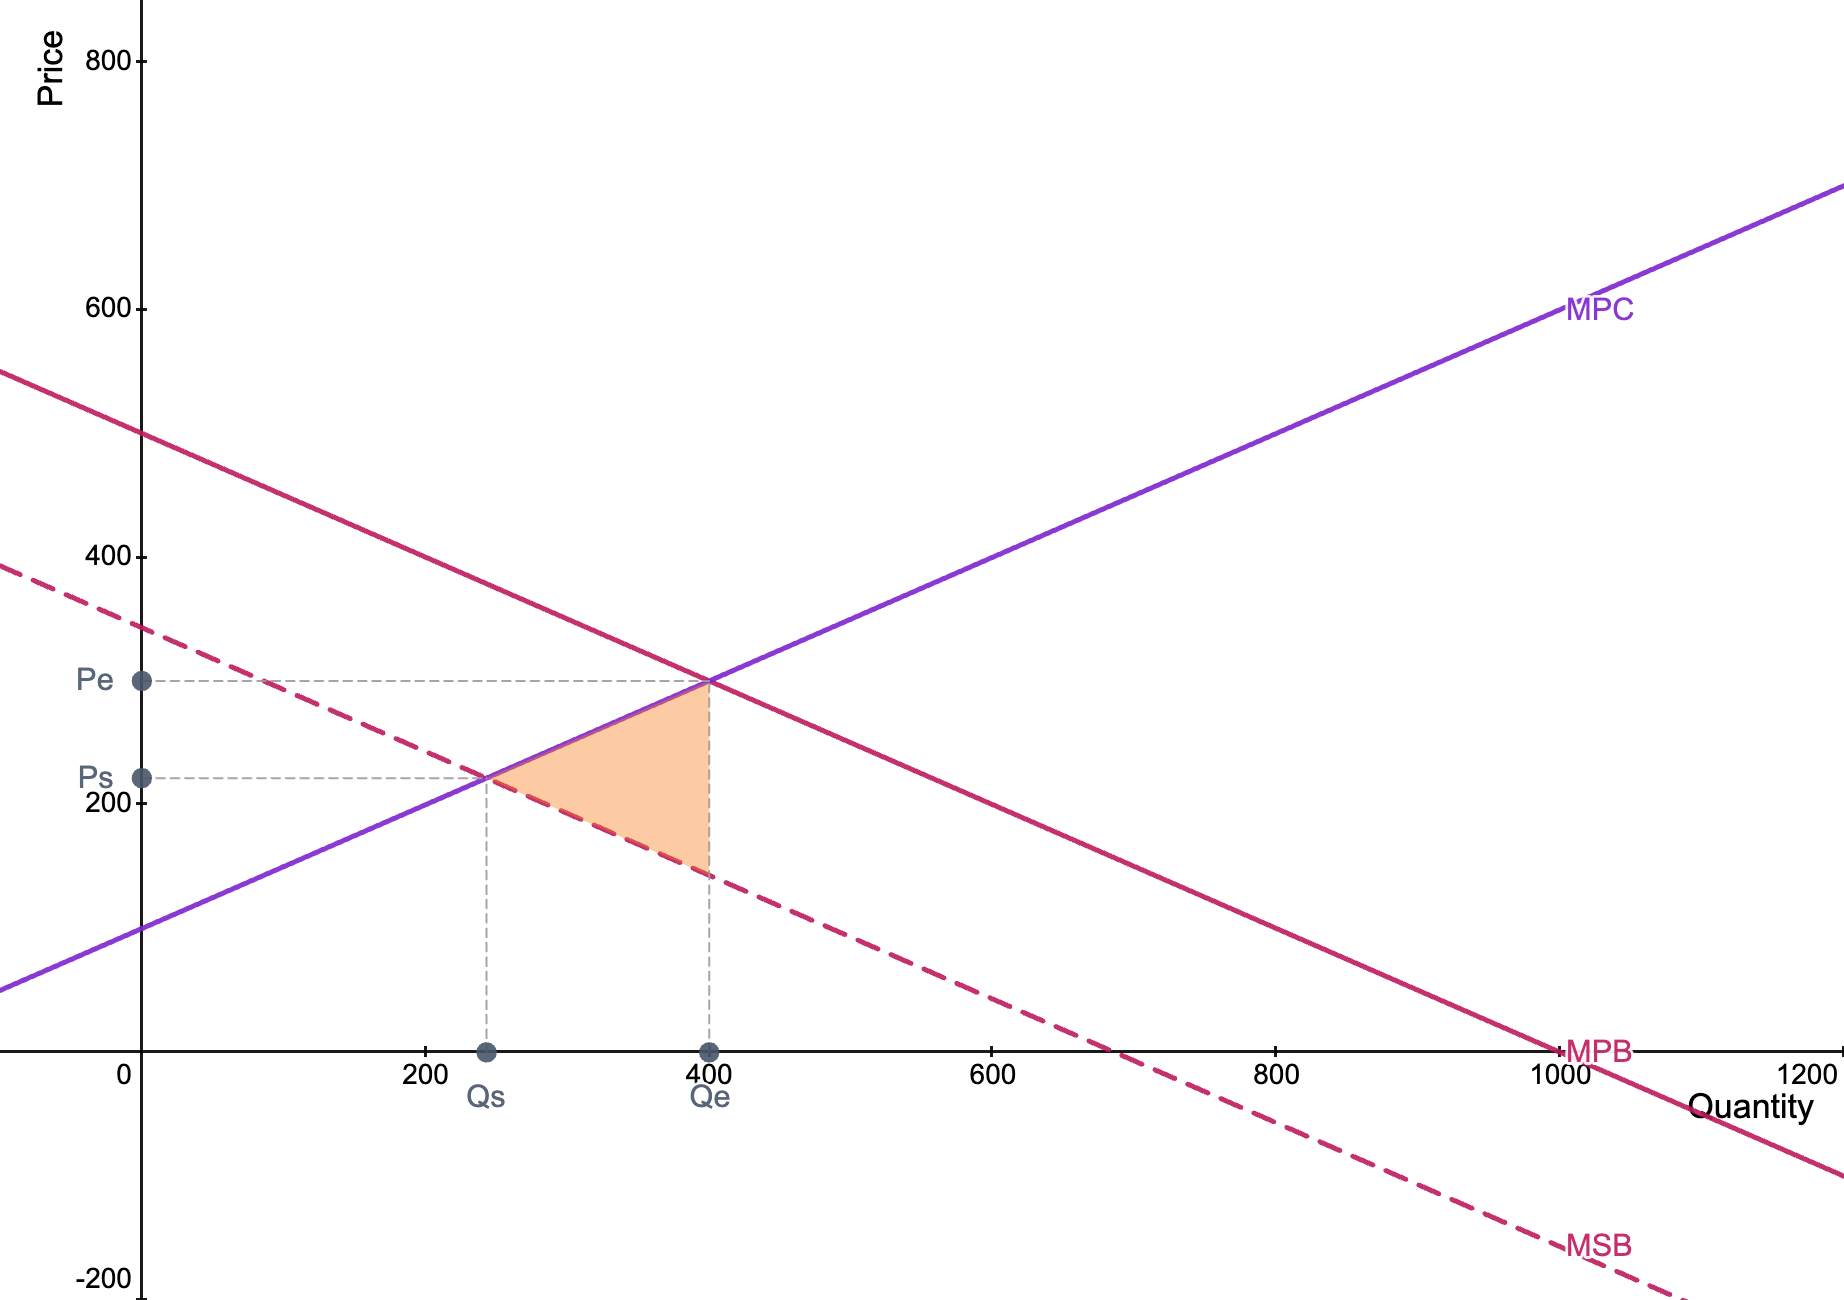
Externalities
Graph positive/ negative externalities in production and consumption
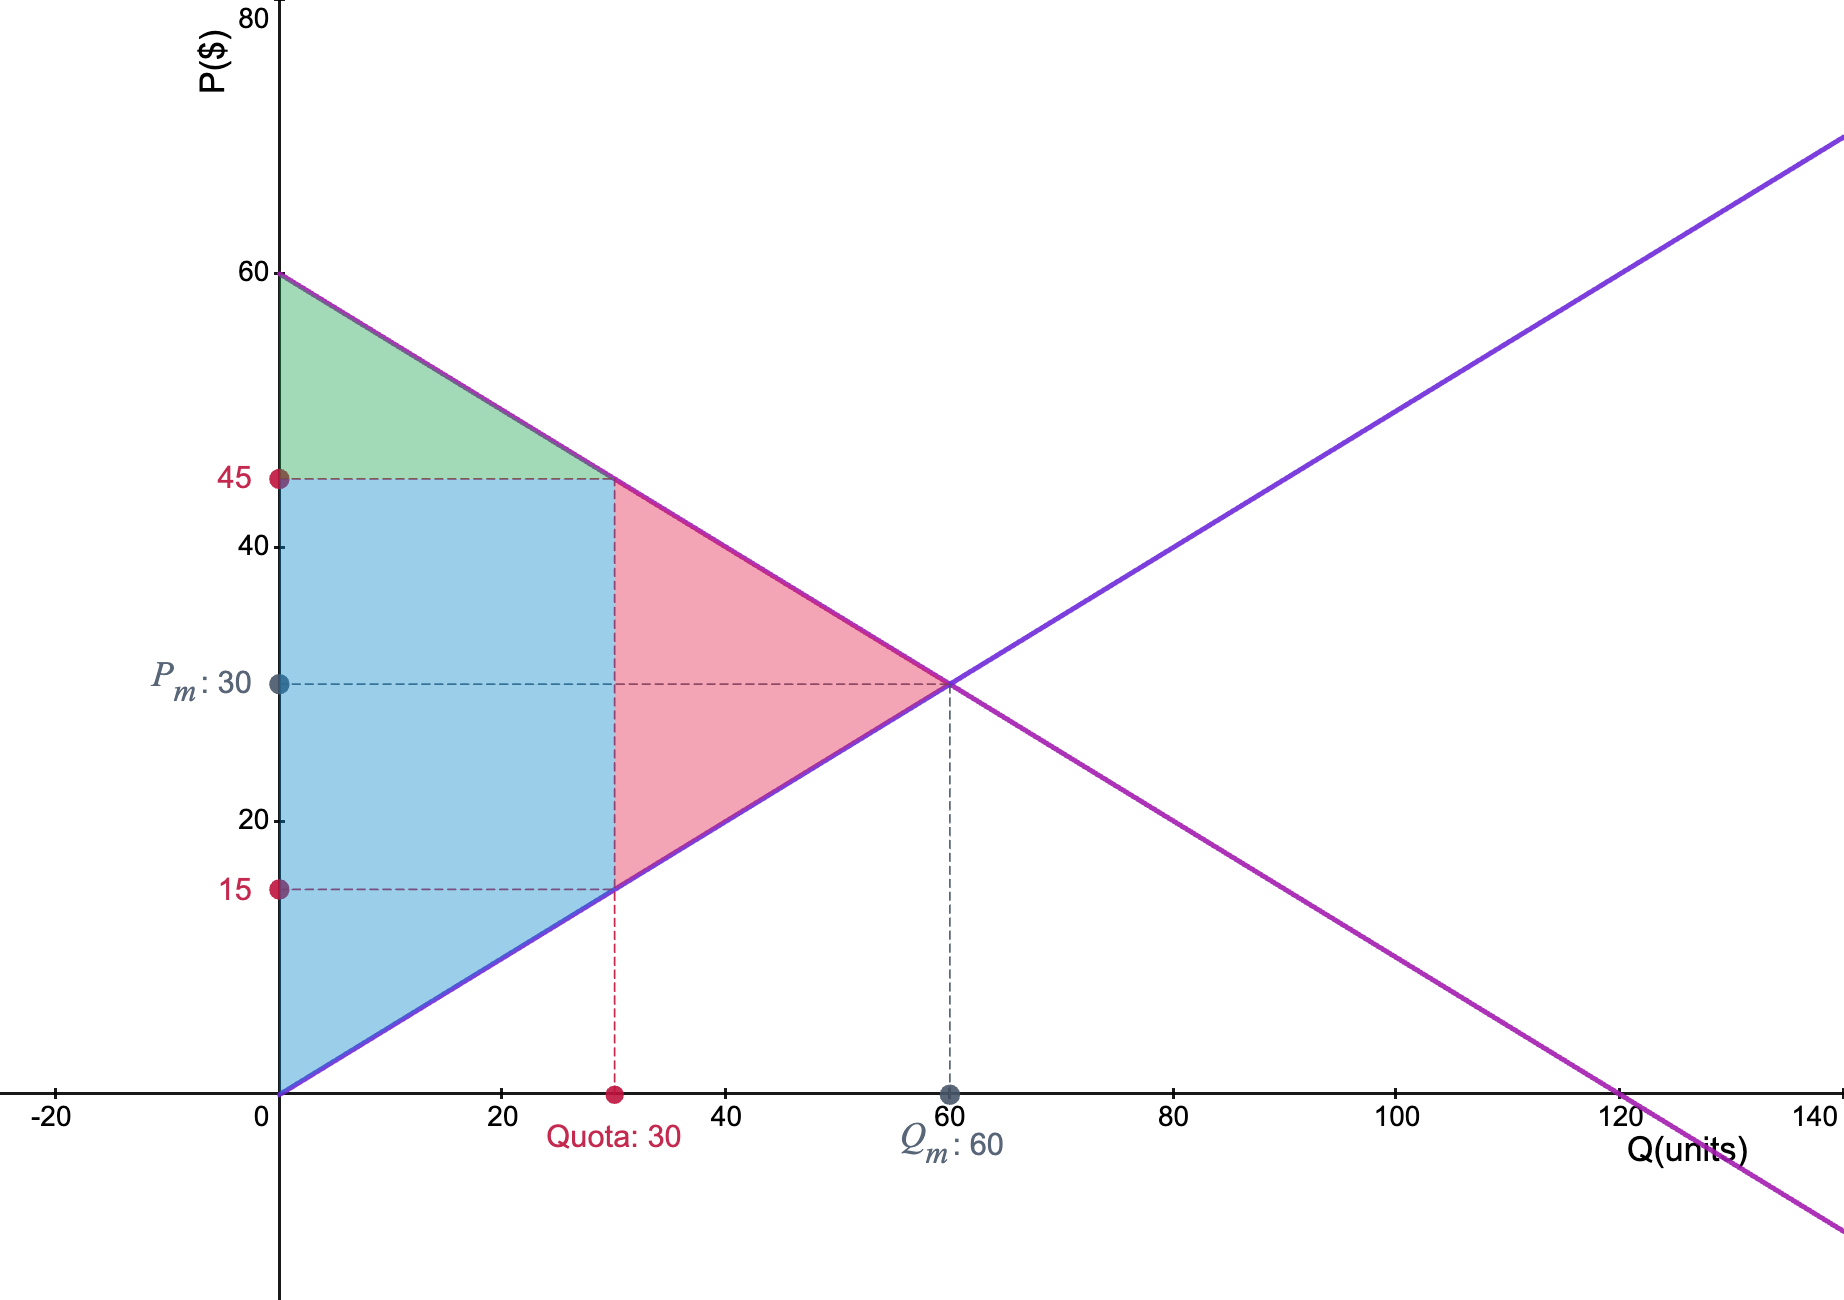
Interventions
Visualize welfare impacts of price floors, price ceilings and quotas
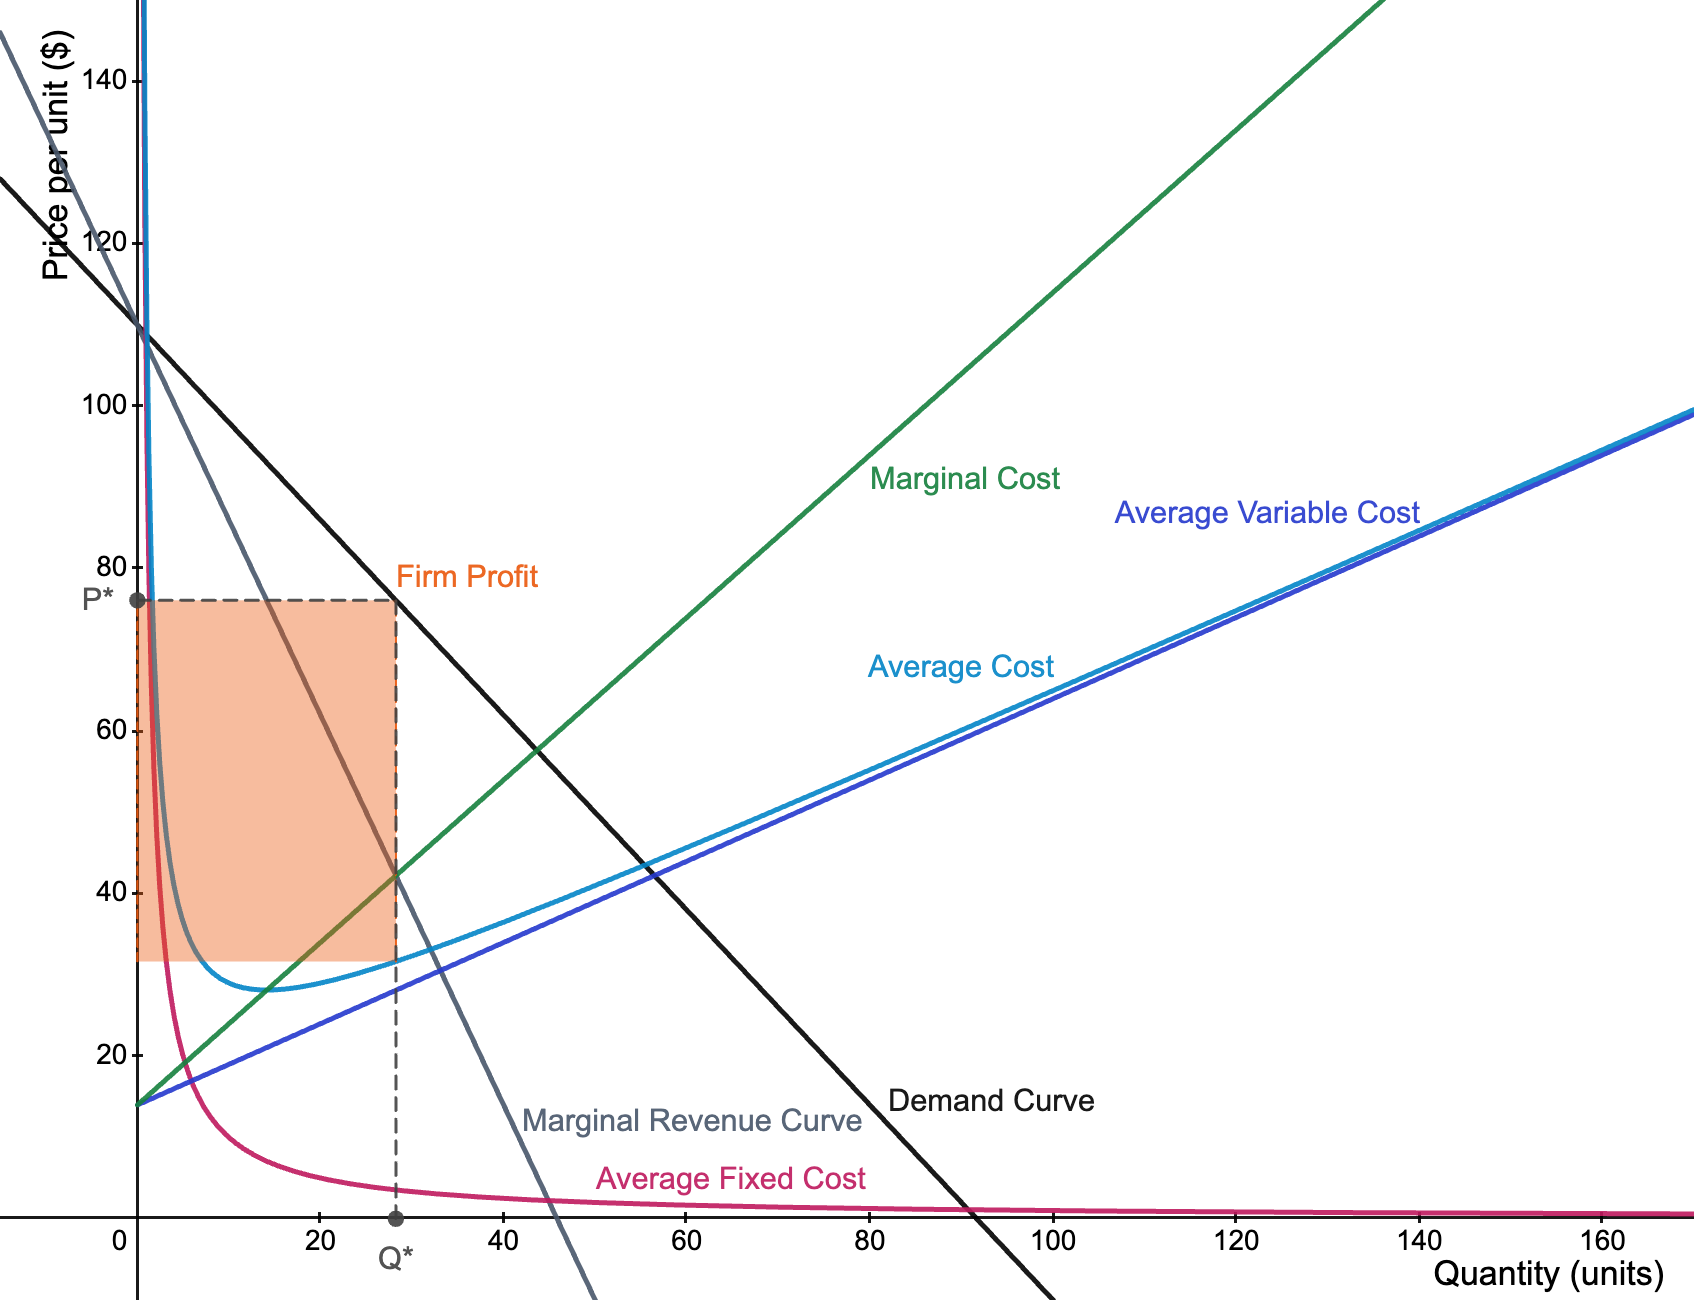
Monopoly
Visualize cost curves and profits in a monopolistic firm
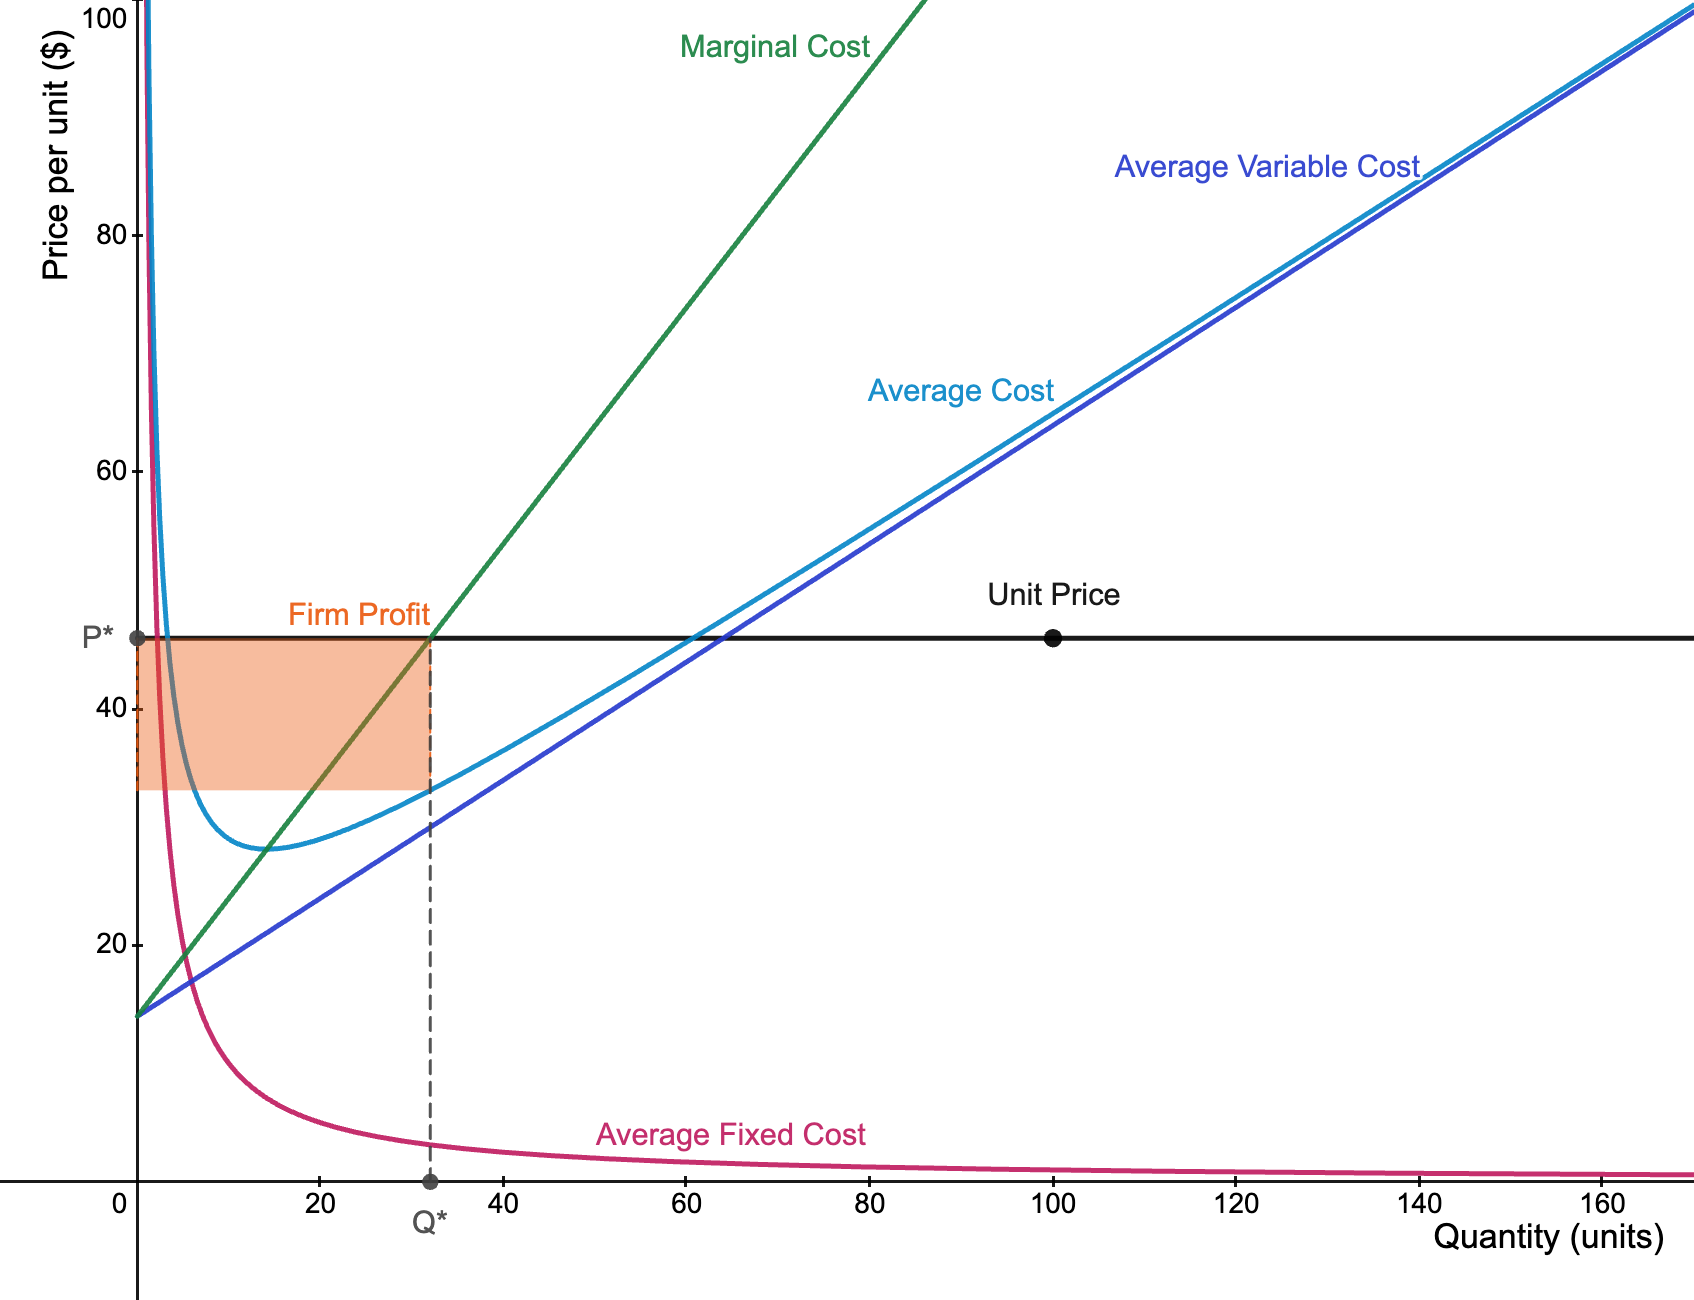
Perfect Competition
Visualize cost curves and profits in a perfectly competitive firm
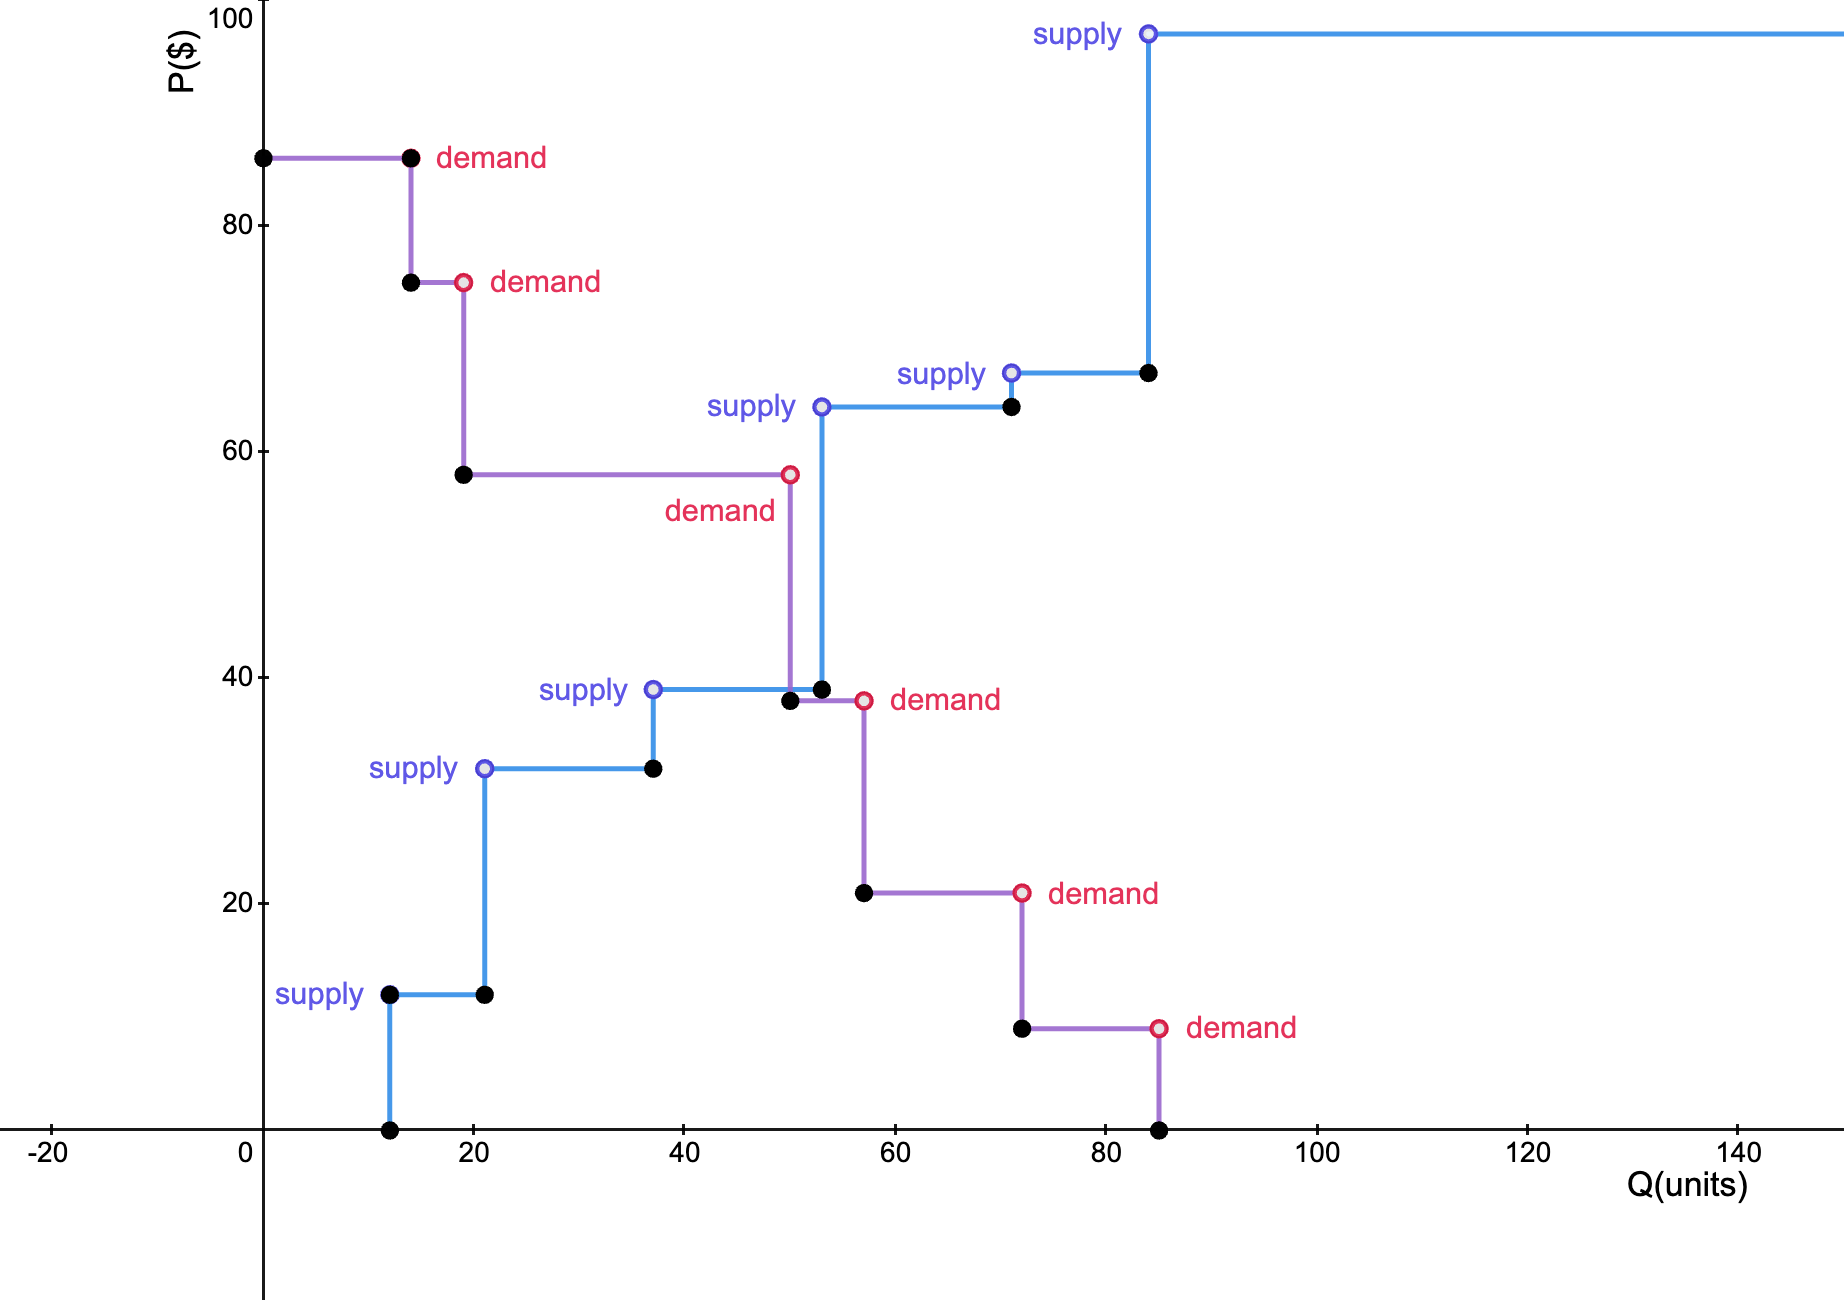
Stepwise Supply and Demand
Graph customizable stepwise supply and demand curves
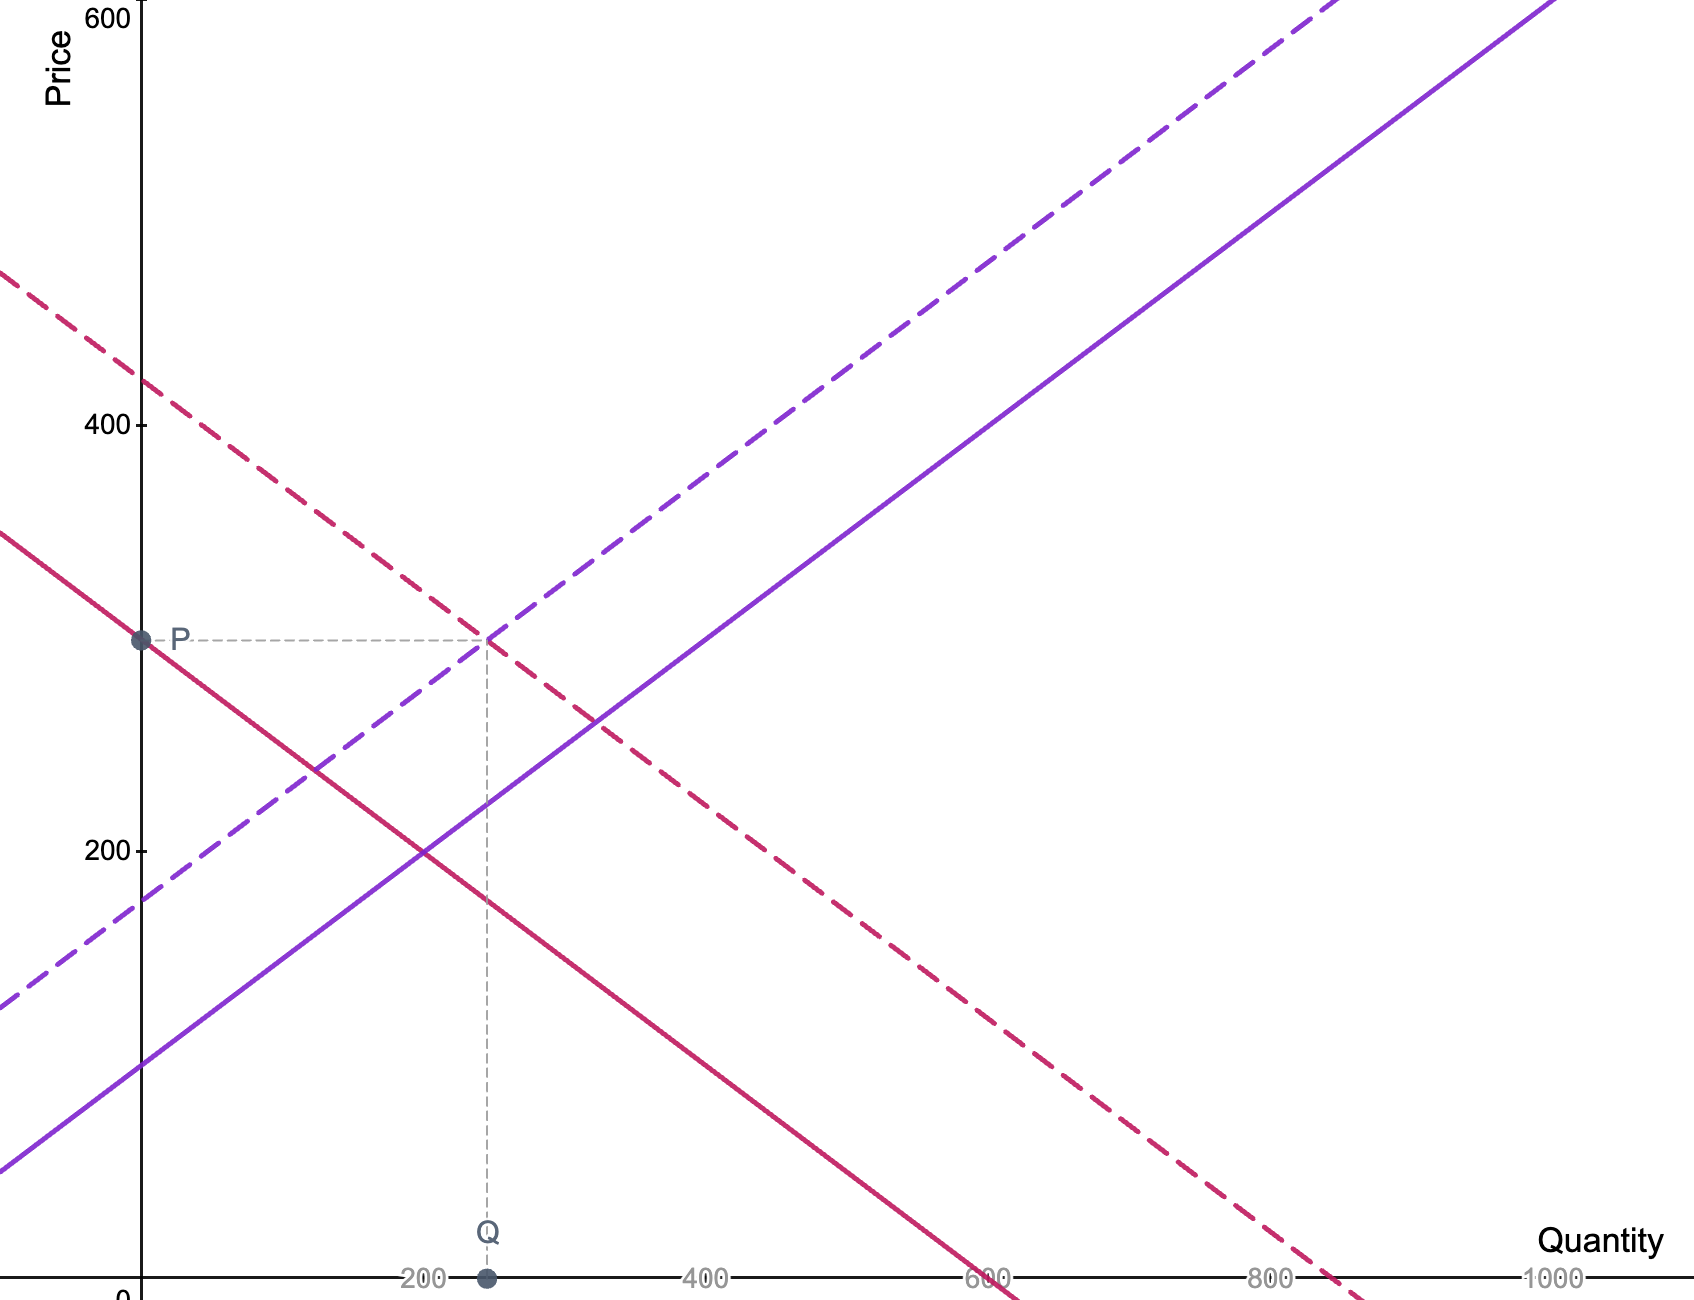
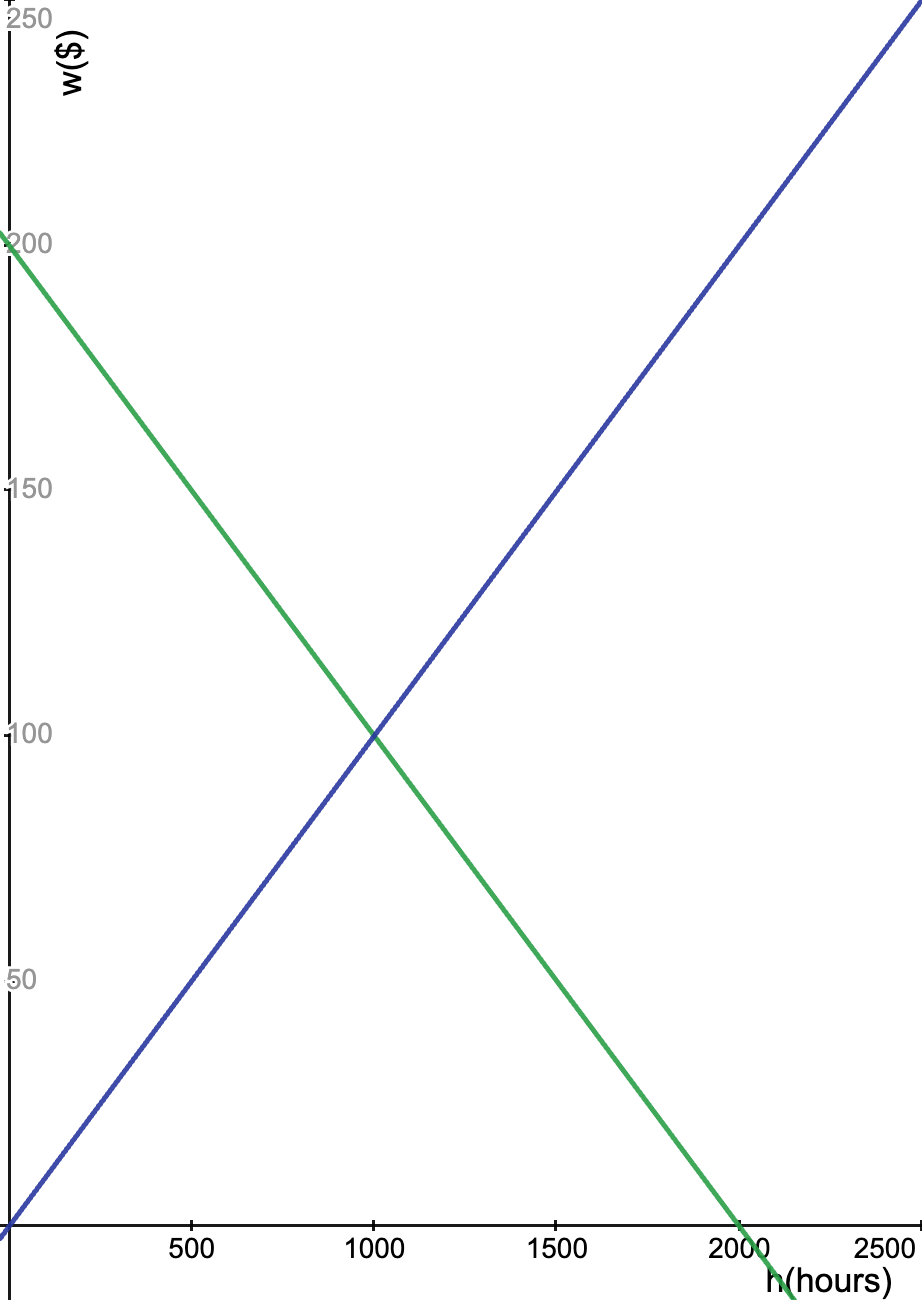
Supply and Demand
Visualize shifts and elasticity changes in supply and demand
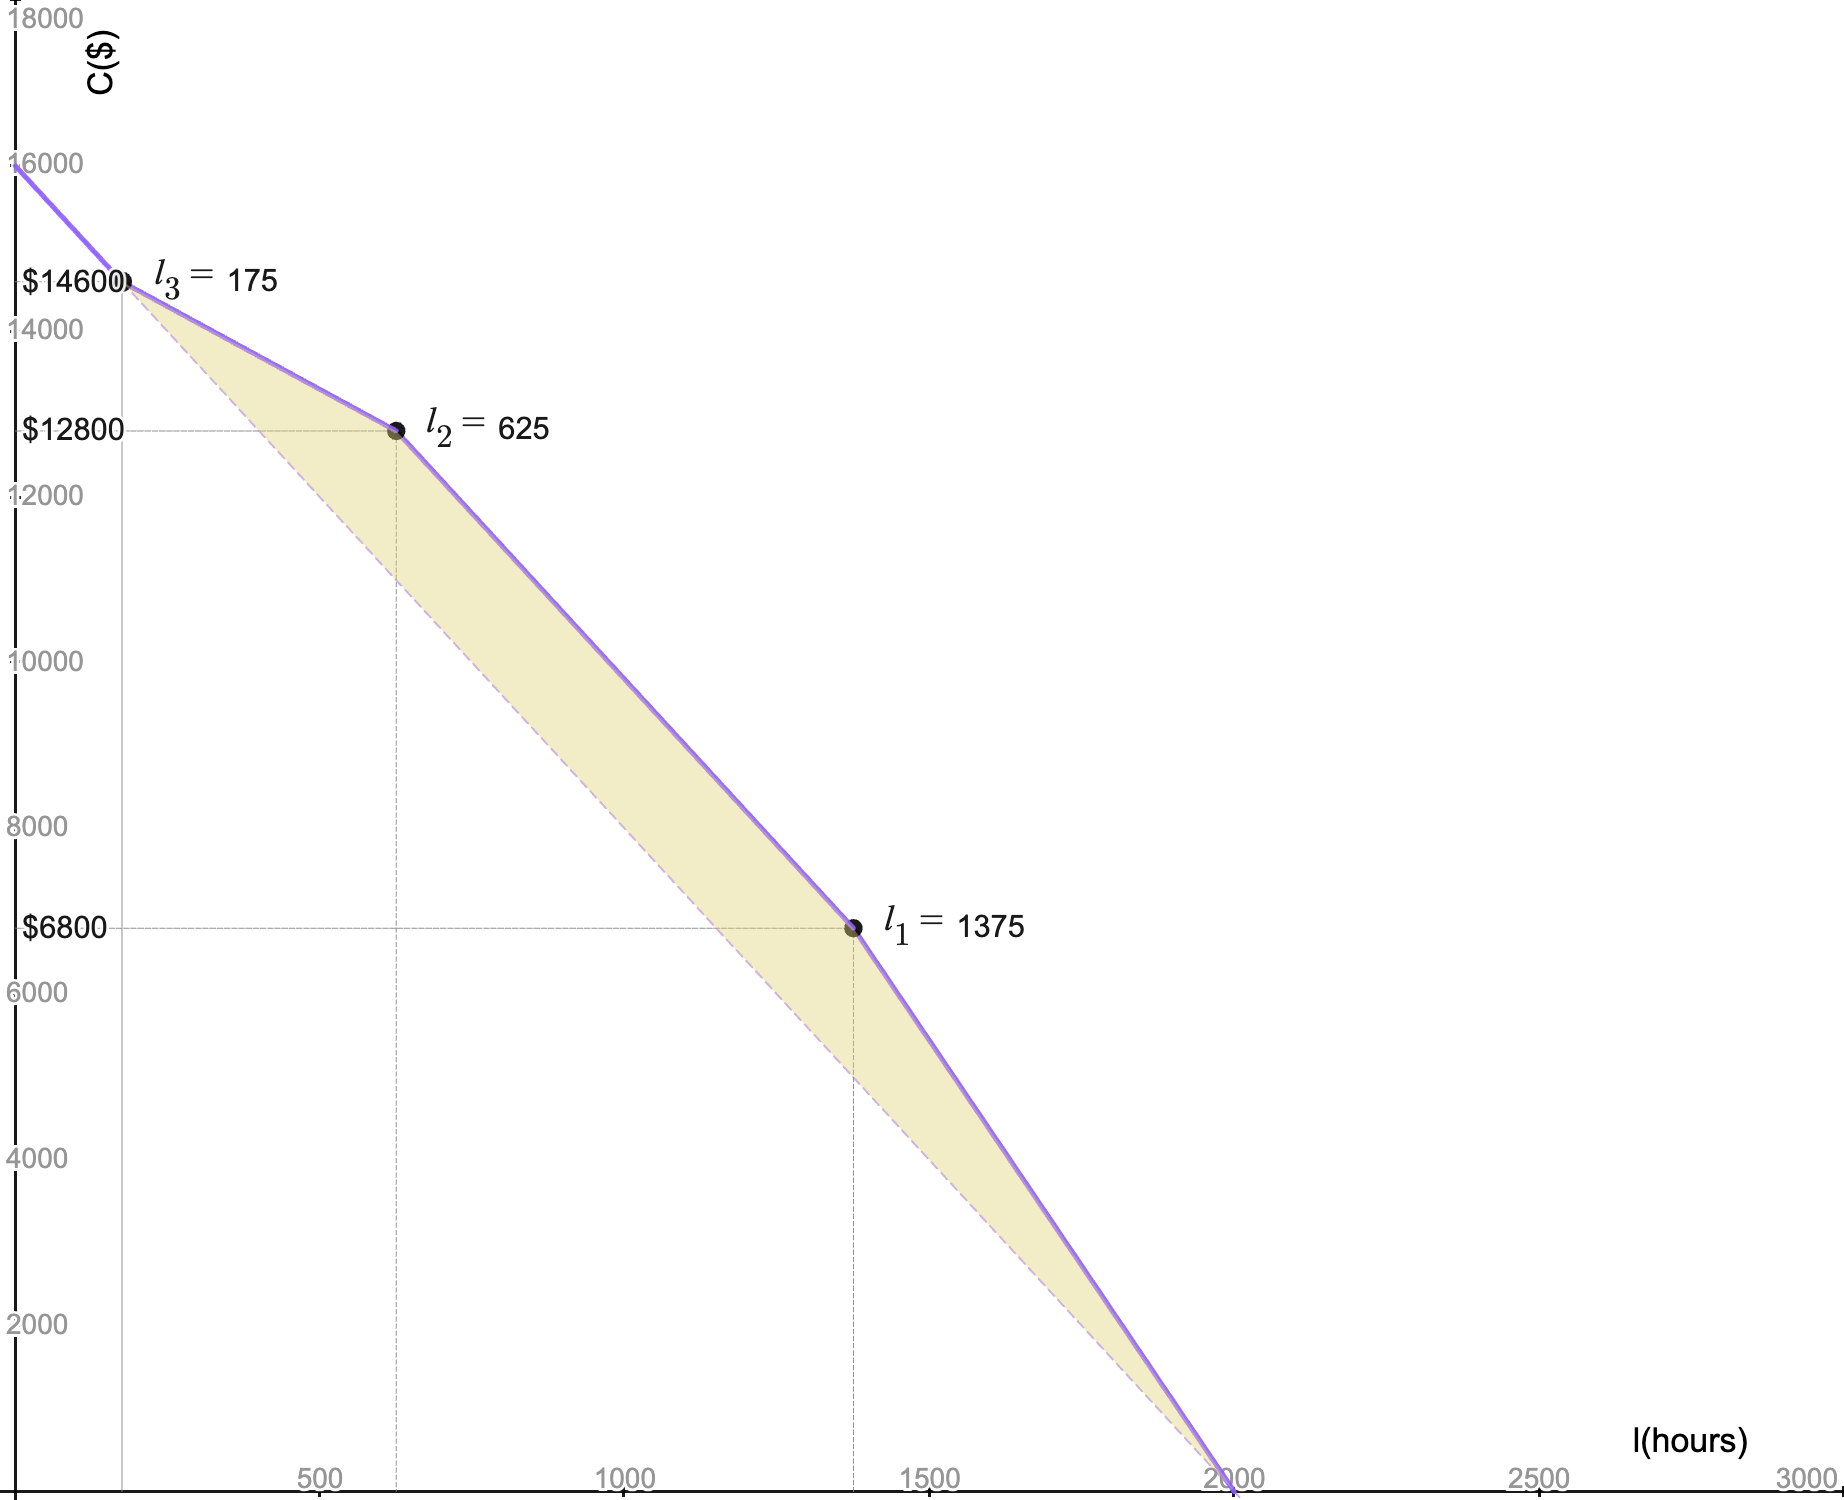
EITC Consumption-Leisure
modeling labor supply responses to Earned Income Tax Credit phase-in/out regions
Progressive Tax Rich Vs Poor
Analyzing differential deadweight loss impacts of taxing higher versus lower income groups
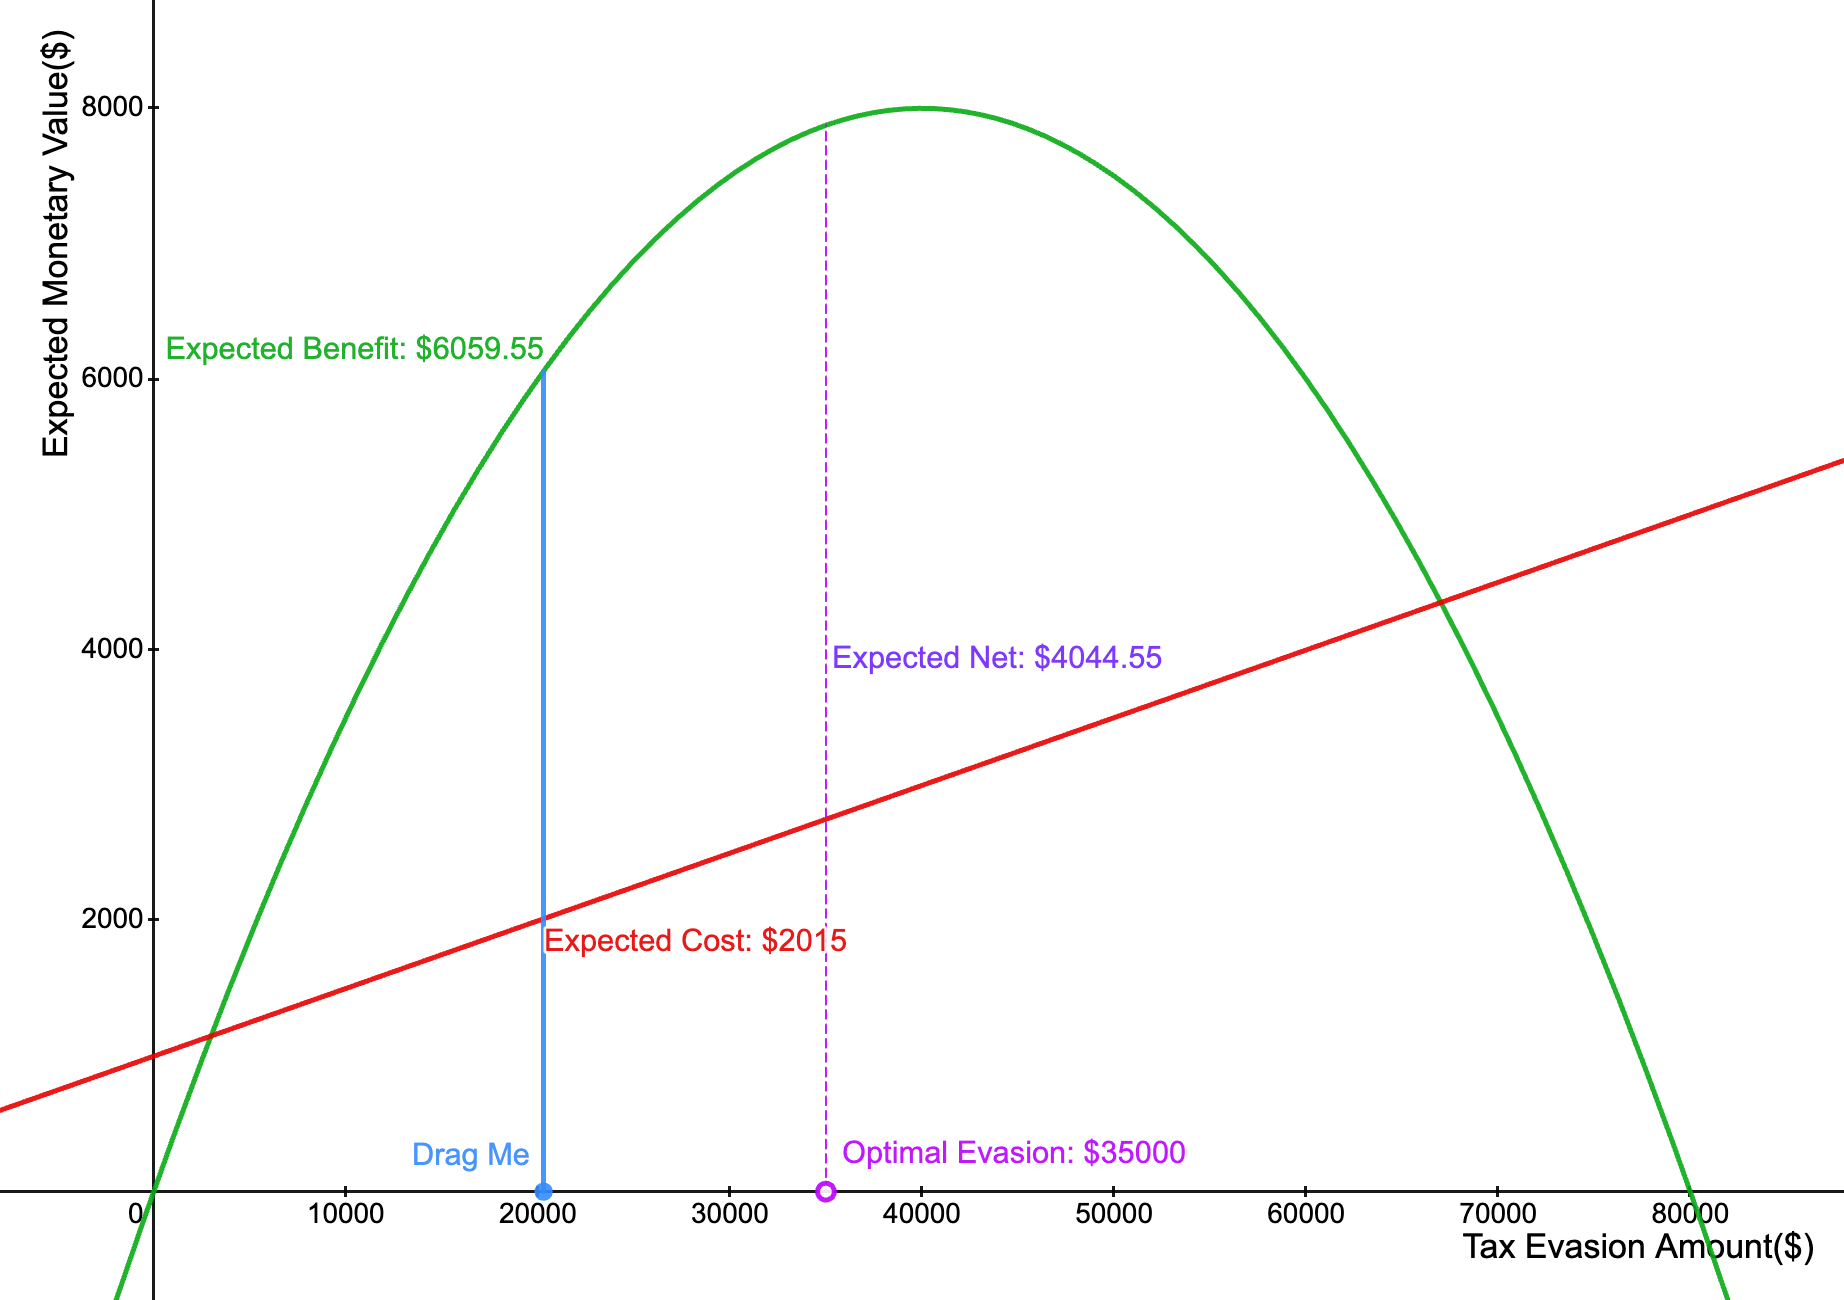
Risk-Neutral Tax Evasion Decision-Making
Optimizing evasion amount where marginal benefit equals marginal cost of detection risk
Tax Incidence in Monopoly
Visualize the impact of taxation on market outcomes using interactive graphs
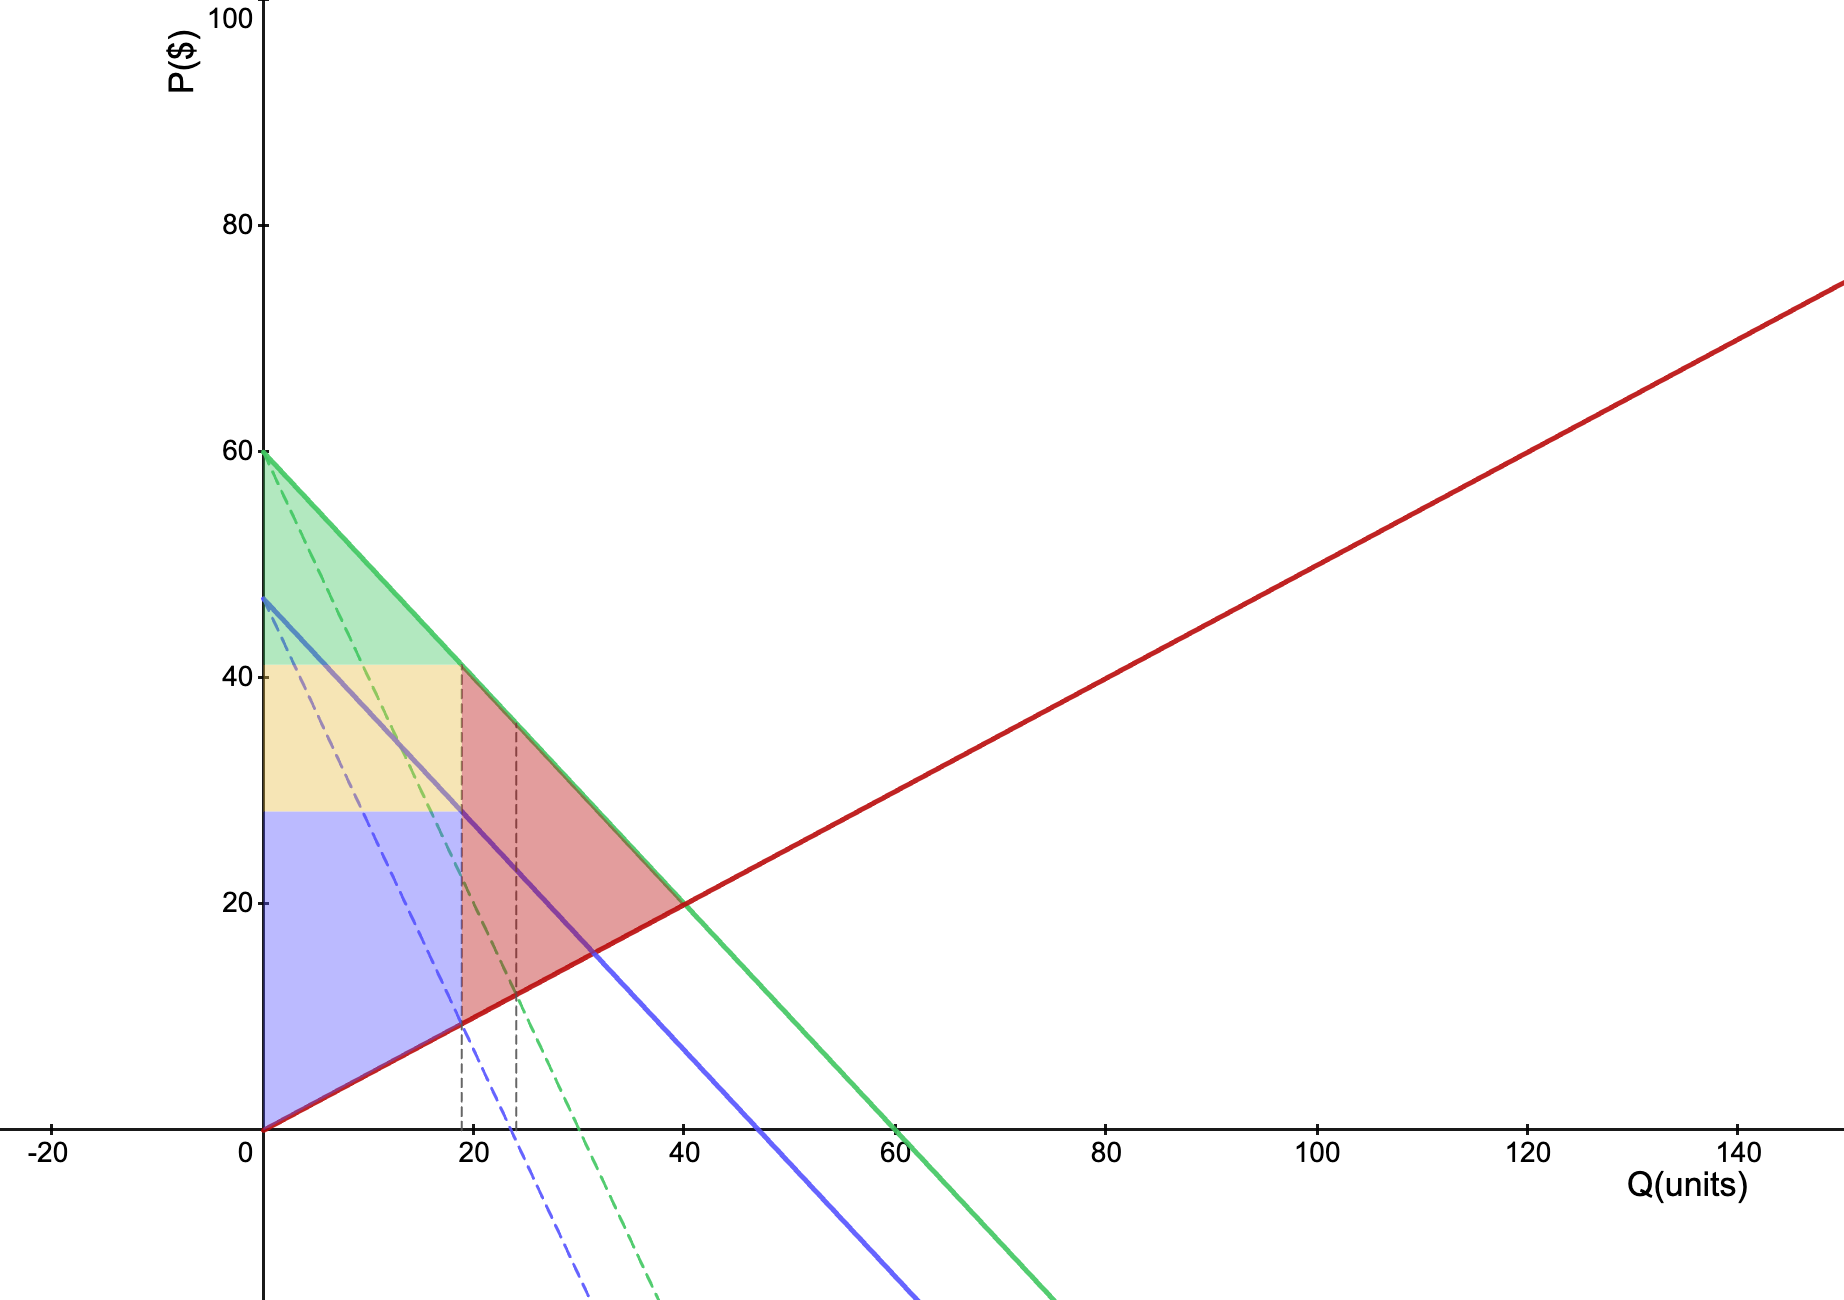
Tax Incidence
Distributional burden of taxes between consumers and producers from demand/supply shifts
Intermediate Microeconomics
-
Exchange Economy
-
Effect of a Price Change
-
Hicksian Demand
-
Marshallian Demand
-
Multi Market Pricing
-
Multiple Marshallian Bundles
-
Price Dynamics
-
Risk - Expected Utility
-
Stackelberg
-
Surplus
Principles of Economics
-
Externalities
-
Interventions
-
Monopoly
-
Perfect Competition
-
Stepwise Supply and Demand
-
Supply and Demand
Public Economy
-
EITC Consumption-Leisure
-
Progressive Tax Rich Vs Poor
-
Risk-Neutral Tax Evasion Decision-Making
-
Tax Incidence in Monopoly
-
Tax Incidence
Course Selection
3
courses
Model Catalog
21
models
Visionary Creators
6
members
Content Collection
4789
words